 Capacity Ledger
Forty-Seven Months Since Chemical Payrolls Were This High
Friday's jobs report named three manufacturing industries that added workers in October. Chemicals went unmentioned and printed 906,900, its biggest payroll since November 2022. Split it by industry and 97 percent of the recovery since March is drug plants and household cleaning products.
Friday's jobs report named three manufacturing industries that added workers in October. Computer and electronic product, machinery, primary metal.
Chemicals went unmentioned, and chemicals is carrying more people than it has carried since 2022.
"The closures are real. So who is doing the hiring?"
Two industries inside NAICS 325, and neither of them sells into your bill of materials.
The Highest Print Since 2022
Chemical manufacturing employed 906,900 people in October, up 300 on the month and the most since November 2022, when the line read 915,200 (chart below).
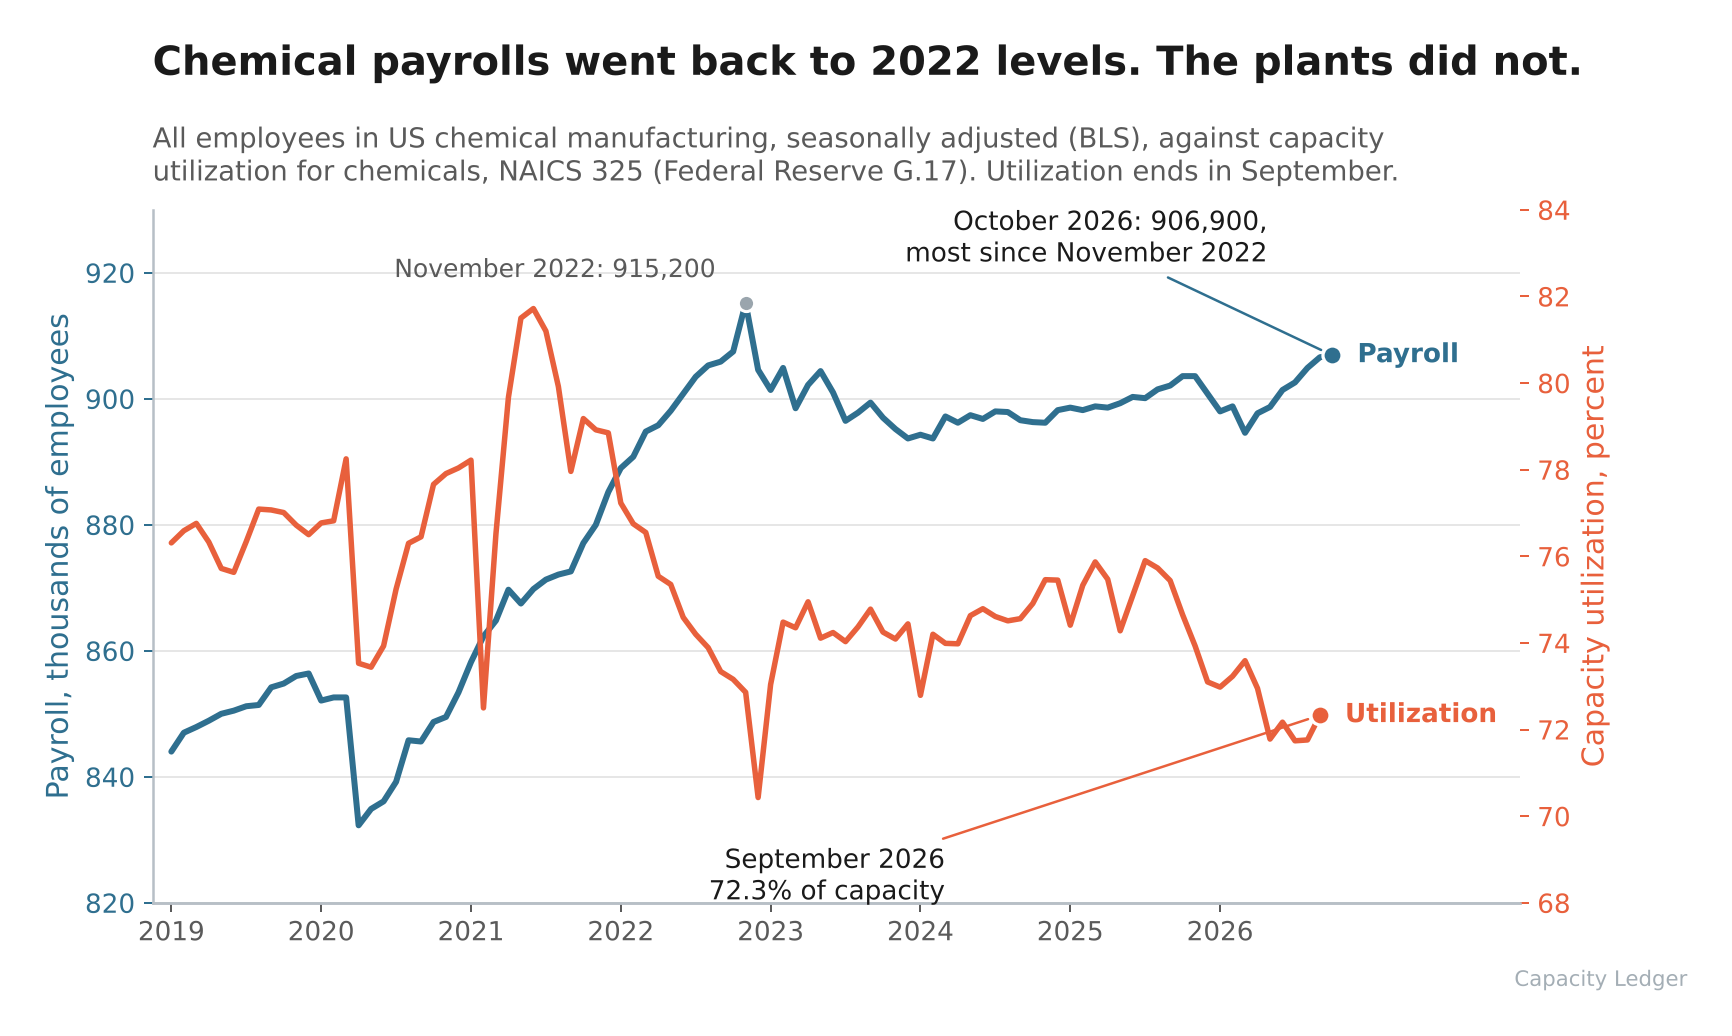
The industry bottomed in March at 894,600. Seven months later it has put 12,300 jobs back on.
Now set that against the rest of the nondurable side of manufacturing.
Nondurable goods lost 45,000 jobs over the twelve months to October. Chemicals, which sits inside that total, gained 3,300.
So the one nondurable industry holding its headcount is the one whose closure announcements you read every week.
Ninety-Seven Percent of It Is Two Industries
BLS publishes the four-digit detail a month behind the headline, so the split runs through September. Through September the gain off the March low was 12,000, and here is where it went:
- Pharmaceutical and medicine manufacturing: +8,700
- Soap, cleaning compound and toilet preparation: +3,000
- The other five chemical industries, combined: -500
Basic chemical manufacturing sits at 151,300, down 1,800 on the year and below where it stood at the end of 2019.
Other chemical product and preparation is worse: down 4,000 on the year and 7,800 short of 2019.
We ran this same split on August 15 against June data and found chemical manufacturing, with pharma taken out, smaller than it was before the pandemic.
Three months of fresh data later the gap has widened.
June had it 2,600 jobs short of December 2019. September has it 3,000 short.
The Payroll Cannot See a Closure
The Fed's September G.17, published October 16, put chemicals at 72.3 percent of capacity against a 1972 to 2025 average of 76.9. By quarter this year it reads 73.3, then 72.3, then 71.9, the weakest of the three.
Three series, one industry, same autumn:
- Output: down 1.3 percent year on year
- Capacity: up 2.9 percent
- Headcount: up 12,300 since March
Here is the catch. A worker counts in the payroll survey if they received pay for any part of the pay period containing the 12th of the month, so a plant with a closure date on the calendar is fully staffed in the data right up to the last shift.
WARN requires 60 days. Announcements run far longer than that.
NexPoint Materials said on November 4 that it will end polycarbonate manufacturing at Burkville, Alabama and move the work to Mount Vernon, Indiana, with production stopping near the end of the first quarter of 2027. We covered that closure Friday morning.
Burkville's people are inside October's 906,900. They will be inside November's, December's, January's, February's and March's.
And Burkville is 36 percent of US nameplate polycarbonate capacity, so the payroll line and the supply line are about to move in opposite directions on one plant.
Final Thoughts
A payroll series is an inventory of employment contracts. A capacity ledger is an inventory of operating assets.
The two agree eventually, and by the time they agree the information has stopped being worth anything to a buyer.
So if you are sizing who can actually ship you product next quarter, the 8-K and the state WARN filing are the series that lead, and Friday's number is the one that confirms what you already priced.
October's utilization figure lands November 17, and a week later the Fed rebases the entire capacity history to 2022. The payroll line will not move with either.
Thanks for reading.