 Capacity Ledger
How Much Finished Chemical Is Actually Sitting There?
US chemical inventories are flat and shipments just set a record, and both of those numbers hide the same thing. Finished goods have fallen to the smallest share of the chemical shelf in the thirty-four years Census has measured it.
Census put out the July manufacturing book on September 2, and the chemical line in it looks like eight months in which nothing happened. Total inventories of $130,893m, against $129,945m last November.
Call it $948m in eight months, on a pile that size.
Then you open the stage-of-fabrication split.
"If the pile is the same size, why is so much less of it ready to ship?"
Same Pile, Different Buckets
Census reports chemical inventories in three buckets. Since November, finished goods went from $61,710m to $58,733m, down 4.8%.
Work in process went from $23,503m to $27,381m, up 16.5%. Materials and supplies moved $47m on a $44.7bn base, which is nothing.
So the total held while $3.0bn came out of the finished tank and $3.9bn went into the reactor.
That puts finished goods at 44.87% of chemical inventories in July against 47.49% in November, and the March reading of 43.51% is the lowest in the 415 months Census has published, back to January 1992 (chart below).
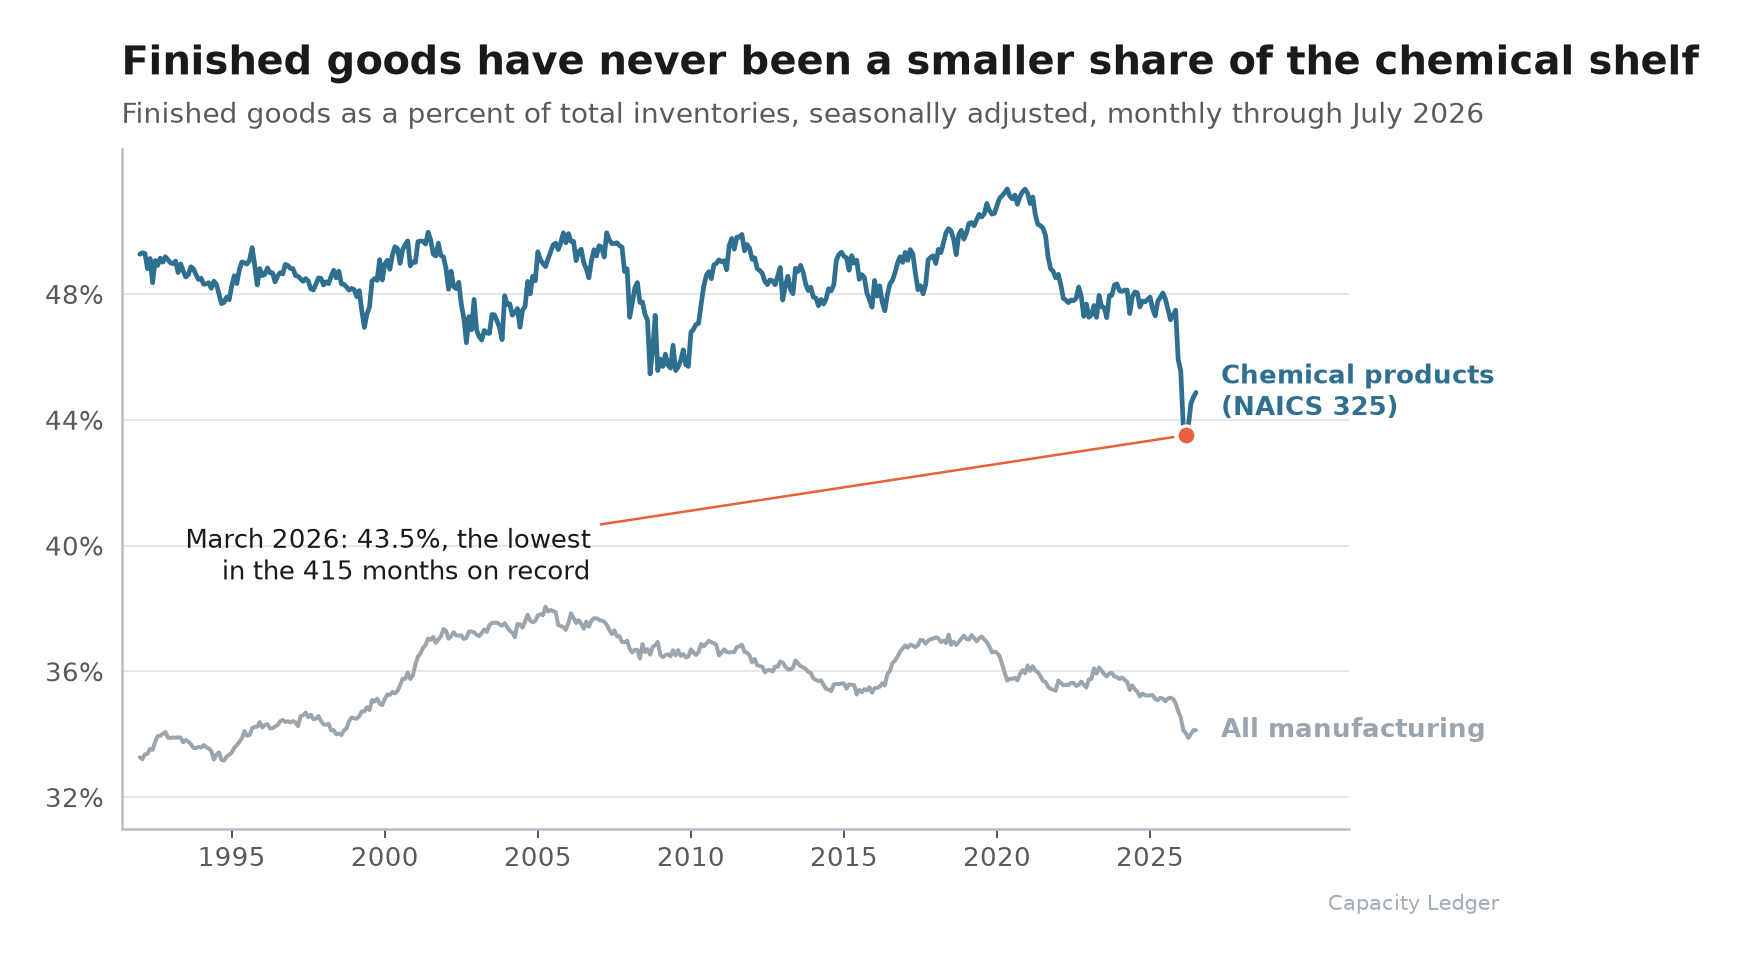
The three components sum exactly to the reported total in every one of those 415 months, so what you are looking at is composition rather than a measurement drifting through the file.
Nothing Moved but the Price
The same release puts chemical shipments at $87,081m in July, up 6.02% from November and a whisker under May's series high.
Now set the BLS producer price index for chemical manufacturing beside it. NAICS 325 went from 356.053 to 377.376 across the same eight months, which is 5.99%.
Two numbers to two decimals, three basis points apart.
The record shipment figure is last November's tonnage at this summer's invoice. Stretch the window to twelve months and a little real growth does show up (shipments +7.72% year over year against PPI +5.55%, call it two points), and all of it happened before November.
The finished-goods decline is also worse than the dollars make it look. Census values M3 inventories "at cost using any valuation method other than LIFO," so a book value that fell 4.8% while the cost of the material inside it rose about 6% is describing a physical drawdown larger than 4.8%.
Chemicals Did This Alone
Manufacturing at large did something much milder. All-manufacturing finished goods went from 34.99% to 34.13% over the same eight months, down 0.86 points, and its own record low is October 1994.
Plastics and rubber moved 0.37 points. Petroleum and coal moved 0.11.
Chemicals moved 2.62 points, three times the manufacturing-wide figure, and it is the only one of the four sitting at a series low.
One honest caveat, because the move is concentrated. Between November and December 2025 alone, finished goods dropped $2,218m while work in process rose $1,863m, close enough to offsetting that a single large respondent changing how it books a stage could account for part of the step.
What makes it worth reading anyway is where the months since have sat. Across the 408 months from January 1992 through December 2025, exactly twelve printed below 46%, and the lowest of those was 45.46% in September 2008. Six of the seven months of 2026 came in under that.
Final Thoughts
The ratio everyone actually watches says chemicals are comfortable: inventories-to-shipments at 1.50 in July, flat for four straight months, well off the 1.73 peak of late 2022.
That ratio counts the reactor charge and the drum in the warehouse the same way. Only one of them can be on a truck tomorrow.
Which is the part that matters if you carry a spot requirement. Your supplier is holding roughly the same money in inventory as a year ago and less of it in a form that has your grade spec on it, in a year when the tonnage did not grow. Worth having in front of you the next time a producer asks for a longer lead time and calls it normal.
Thanks for reading.