 Capacity Ledger
How the Fiber Chain Finished Its Closure Wave
US artificial and synthetic fiber capacity is down 29% since 2019 and the plants still standing run at 98%. Synthetic rubber has given up 4% of its capacity and runs at 57%. Both sit inside the 72.1% the Fed printed for chemicals.
US chemical manufacturing capacity grew 2.8% in the twelve months to June.
That is the fastest twelve-month expansion in the Federal Reserve's series for NAICS 325 since April 2008. Total industry capacity grew 1.3% over the same year, so chemicals expanded at better than double the rate of American industry, in a year we spent filling a ledger with closure notices.
The operating rate went the other way. Chemicals ran at 72.1% of capacity in June, 4.8 points below its 1972-2025 average of 76.9.
Manufacturing as a whole sat 2.5 points under its own long-run average.
We wrote that gap up on July 27 and told you 325 was the finest cut the Fed publishes.
That was wrong, and the correction is the story.
"If the aggregate is hiding the answer, what does the Fed publish underneath it?"
The Finest Cut Is Not 325
The G.17 tables carry one chemicals row. The data files behind them carry four.
Alongside G325 for all of chemical manufacturing, the Board's seasonally adjusted capacity file publishes plastics material and resin (325211), synthetic rubber (325212), and artificial and synthetic fibers and filaments (32522). Each has a matching production index in the companion file.
No utilization table prints those three. You do not need one, because utilization is production index / capacity index and nothing else.
Run June's chemicals pair through it, 101.6353 over 140.9070, and you get the 72.1 the Board published.
So the identity holds, and the same arithmetic works one level down.
What is genuinely missing is different from what we said. Basic chemicals (3251) and pharmaceuticals (3254) each get a production index and no capacity index at all, which is why nobody can split the aggregate cleanly into your half and the drug industry's half.
Three Series, One Aggregate
Here is what the three published sub-industries did in the year to June 2026.
- Plastics material and resin: +0.34%. The Gulf Coast build landed between 2021 and 2022 and the line has been flat for four years.
- Synthetic rubber: +0.74%. Capacity sits 4.2% below January 2019 and roughly where it was in 2022.
- Artificial and synthetic fibers: -0.29%, and 28.7% below January 2019 (chart below).
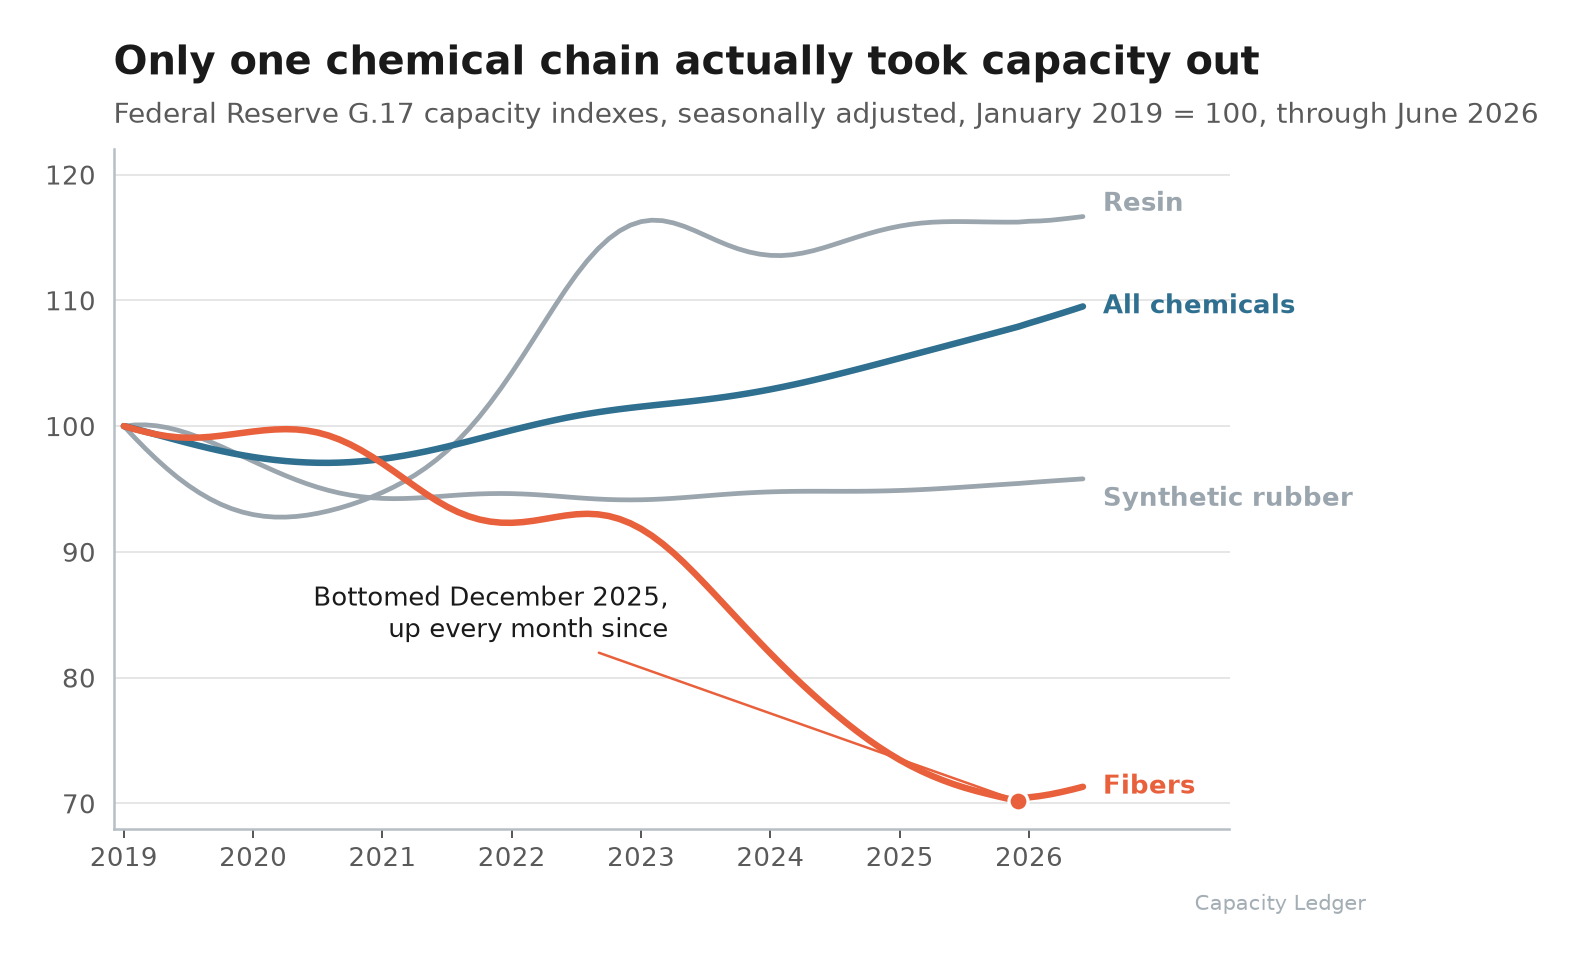
Now put those three next to the 2.8% the aggregate printed.
An index built from its components cannot outrun every component the Board measures. Everything else inside 325, the pharmaceutical plants, the ag chem, the paints and the soaps and the basic chemicals outside 3252, has to be growing faster than 2.8% to pull the total there.
We can say where the growth is absent. Naming where it lands would take a capacity index the Fed declines to publish.
What a Ninety-Eight Means
Run the identity on all three and June 2026 looks like this: resin at 83.8%, synthetic rubber at 56.9%, fibers at 98.2%.
That is 41 points of spread inside one two-digit code, sitting under a headline of 72.1.
The fiber number is what a finished rationalization looks like. Close to 29% of the capacity is gone since 2019 and the units left standing run flat out, above 100% for four months of late 2025 against the Board's sustainable-output estimate.
Synthetic rubber is the same industry at the opposite end of the same process. Capacity has barely moved in four years, the rate fell from 58.4% a year ago to 56.9% in June, and nothing has come out to meet the demand that left.
If fiber sits in your bill of materials, a supplier's tightness argument has a real number behind it this quarter. If you buy synthetic rubber, ask which unit.
And the fiber line has already turned. It bottomed at 70.91 in December 2025 and has risen in every month of 2026, +1.62% off the trough, the first stretch of six consecutive increases since 2022.
Final Thoughts
June is preliminary and the Board revises this whole series every autumn, so treat the last few months as a direction rather than a level.
The direction is the useful part. On July 27 we said the most valuable signal in this dataset is the month a capacity line changes direction, because that is when pricing power comes back.
For all of chemical manufacturing that month has not arrived. For fibers it arrived eight months ago, and the rate above 98 says the market noticed before the index did.
One number for an industry that runs everything from acrylic staple to butyl rubber was always going to average away the only thing a buyer needs. The finer cut was sitting in the same file the whole time.
Thanks for reading.