 Capacity Ledger
Near Shore Is Eight Percent of America's Penicillin
OMB is asking chemical and petrochemical manufacturers to report idle domestic or near shore capacity behind the ASPR 86 list, and it added amoxicillin to the ask by hand. Seven years of the penicillin import book say the near shore share has already fallen by two thirds.
The largest single origin of American penicillin is Bulgaria.
It has held that spot every year since 2019, and in 2025 it was 43.7 percent of the tonnage on the line.
We went looking because of a document. On Friday the Office of Management and Budget published a request for information at 91 FR 60983, conducting market research to find "new and unused (idle) domestic, U.S.-based, and near shore production capabilities" for the finished doses, APIs and key starting materials behind the ASPR 86 list of essential medicines. The desk read that notice Friday morning and wrote about the thirty-one day clock it starts, closing October 26, and about the sentence that drags this readership in: information is requested from "qualified manufacturers within the pharmaceutical, chemical, and petrochemical sectors."
What we did not do was check the map.
"If near shore is the standard, how much of the molecule already arrives from near shore?"
OMB named two antibiotics that are not on the ASPR 86 list and asked for them anyway, "due to potential supply chain vulnerabilities." One is amoxicillin. It is a penicillin with a penicillanic acid structure, which puts it in HTS heading 2941.10, a heading that breaks into exactly four ten-digit lines: ampicillin, penicillin G salts, a named set of five specific penicillins, and Other. Amoxicillin is in Other.
The 1,547 tonnes, and the fifteen places they come from
US imports under 2941.10 in 2025 were 1,547,036 kg on $58,927,589 of customs value.
We swept every partner code on the UN Comtrade preview and got fifteen origins that sum to the world row exactly, to the kilogram and the dollar. No residual, no "other" bucket.
Five of them are 96.7 percent of the weight:
- Bulgaria, 675,359 kg
- China, 427,792 kg
- Spain, 216,633 kg
- Mexico, 117,981 kg
- Italy, 58,500 kg
India is on the list at 2,791 kg, which is 0.18 percent. In 2019 it shipped 99,477 kg of this heading, so that position is down 97 percent in six years.
The country most people name first when they talk about generic antibiotics has effectively left the American bulk penicillin book.
Near shore is a short list
Mexico and Canada together were 23.4 percent of the heading in 2019. In 2025 they were 8.2 percent (chart below), and the fall happened in one step, in 2022, when Mexico went from 322,997 kg to 126,814 kg and stayed down.
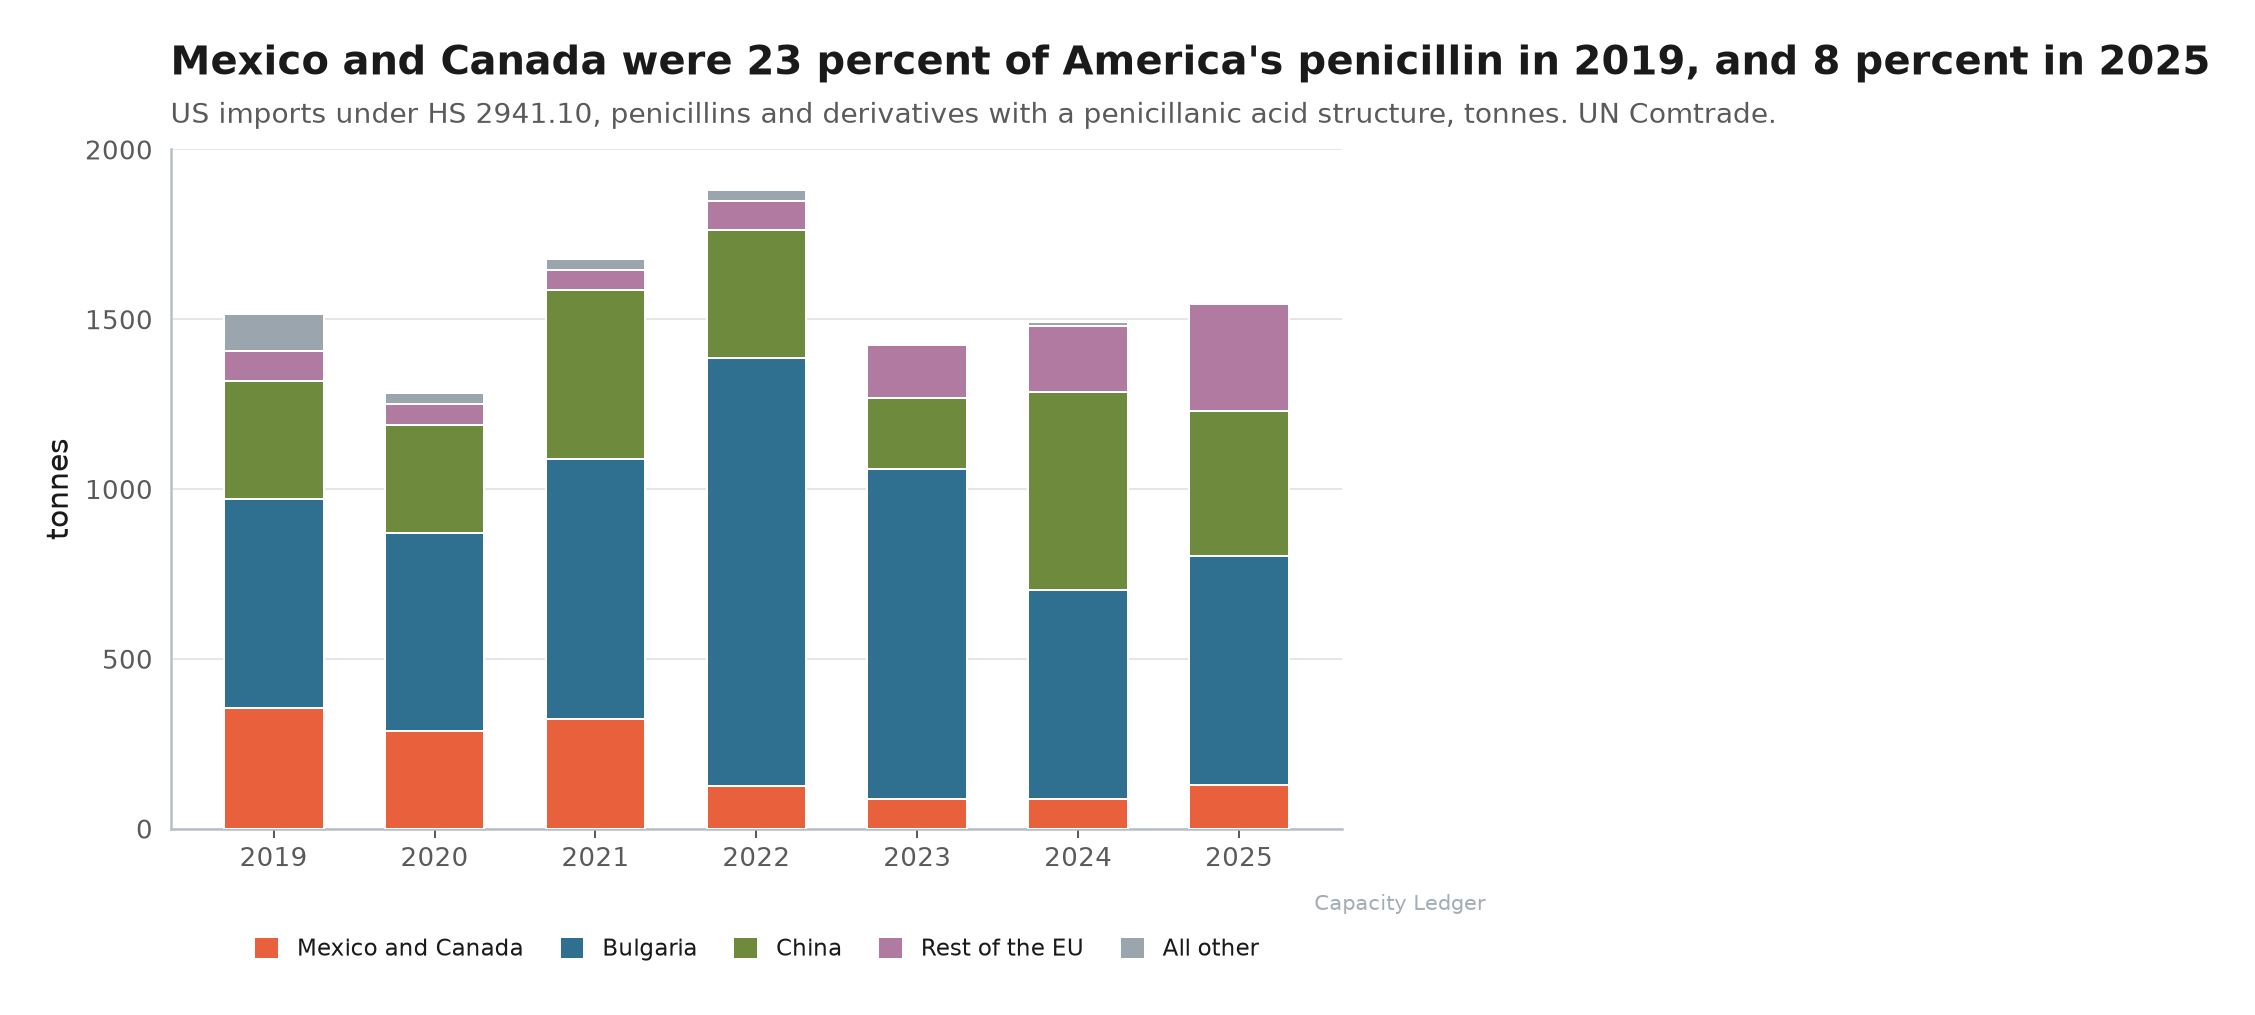
Now look at what the same chart says about the total.
Seven years, and the bar tops barely move: 1,514 tonnes in 2019 against 1,547 tonnes in 2025, up 2.2 percent. The volume America buys is a flat line, and the map underneath it keeps rearranging.
Two things fall out of that for anyone drafting a response this month:
- The RFI fences out Foreign Entities of Concern by its own definition, which covers anything "owned by, controlled by, or subject to the jurisdiction or direction of" China, Russia, Iran or North Korea. That is 27.7 percent of the 2025 tonnage gone by rule, before anyone assesses a single plant.
- Bulgaria and China together have been at least 70 percent of this heading every year since 2020, and they peaked at 86.9 percent in 2022. The concentration is not new and it is not drifting away.
One heading, two very different products
Here is the catch, and we would rather state it than let someone find it. 2941.10 is a six-digit heading and the unit values inside it run from $10.88/kg on the Belgian tonnage to $207.76/kg on the Italian. Bulgaria lands at $26.60, China at $32.33. That spread is bulk salts and finished semi-synthetic APIs sharing one line, and nobody should read the heading as a proxy for amoxicillin API by itself.
So we checked the claim on the other column.
Weighted by customs value instead of weight, Mexico and Canada are 7.5 percent of 2025, against 8.2 percent by weight. The number survives the switch.
The value column has its own story, incidentally. The same flat 1,500 tonnes cost $114.6m in 2019 and $58.9m in 2025, an implied unit value of $75.70/kg falling to $38.09/kg.
Whatever else has happened to this molecule in seven years, it has gotten cheaper to buy by half.
Final Thoughts
An import series tells you where tonnes came from. It says nothing about what sits idle in a building somewhere in Texas.
That is the gap OMB is trying to close here, and it is why the disclosure schedule asks for current production, unused capacity, and a timeline to full operational capacity in the same breath.
What the trade data can do is set the bar.
For the one molecule OMB had to add to its own list by hand, near shore is eight percent, the fenced-out origin is another twenty-eight, and the rest is Europe. Anyone responding by October 26 with a real restart curve has a thin field to stand out from.
Thanks for reading.