 Capacity Ledger
The Soda Ash Stockpile Outgrew the Shutdown
US soda ash producers finished June holding 646,000 tons, 45 percent above any month since the end of 2023 and 78 percent above the highest year-end of the last five years. Production had already been cut 10 percent and a California plant had already gone dark. The export book fell faster than either.
If you buy soda ash on a calendar-year contract, the number that sets up your 2027 position is already public, and it is four months old.
USGS put end-of-June producer stocks at 646 thousand metric tons.
That is the highest month anywhere in the Mineral Industry Survey record we can assemble, which runs back to December 2023, and it sits 45% above the previous high of 445 in November 2025 (chart below). Three months before it, the same series read 267.
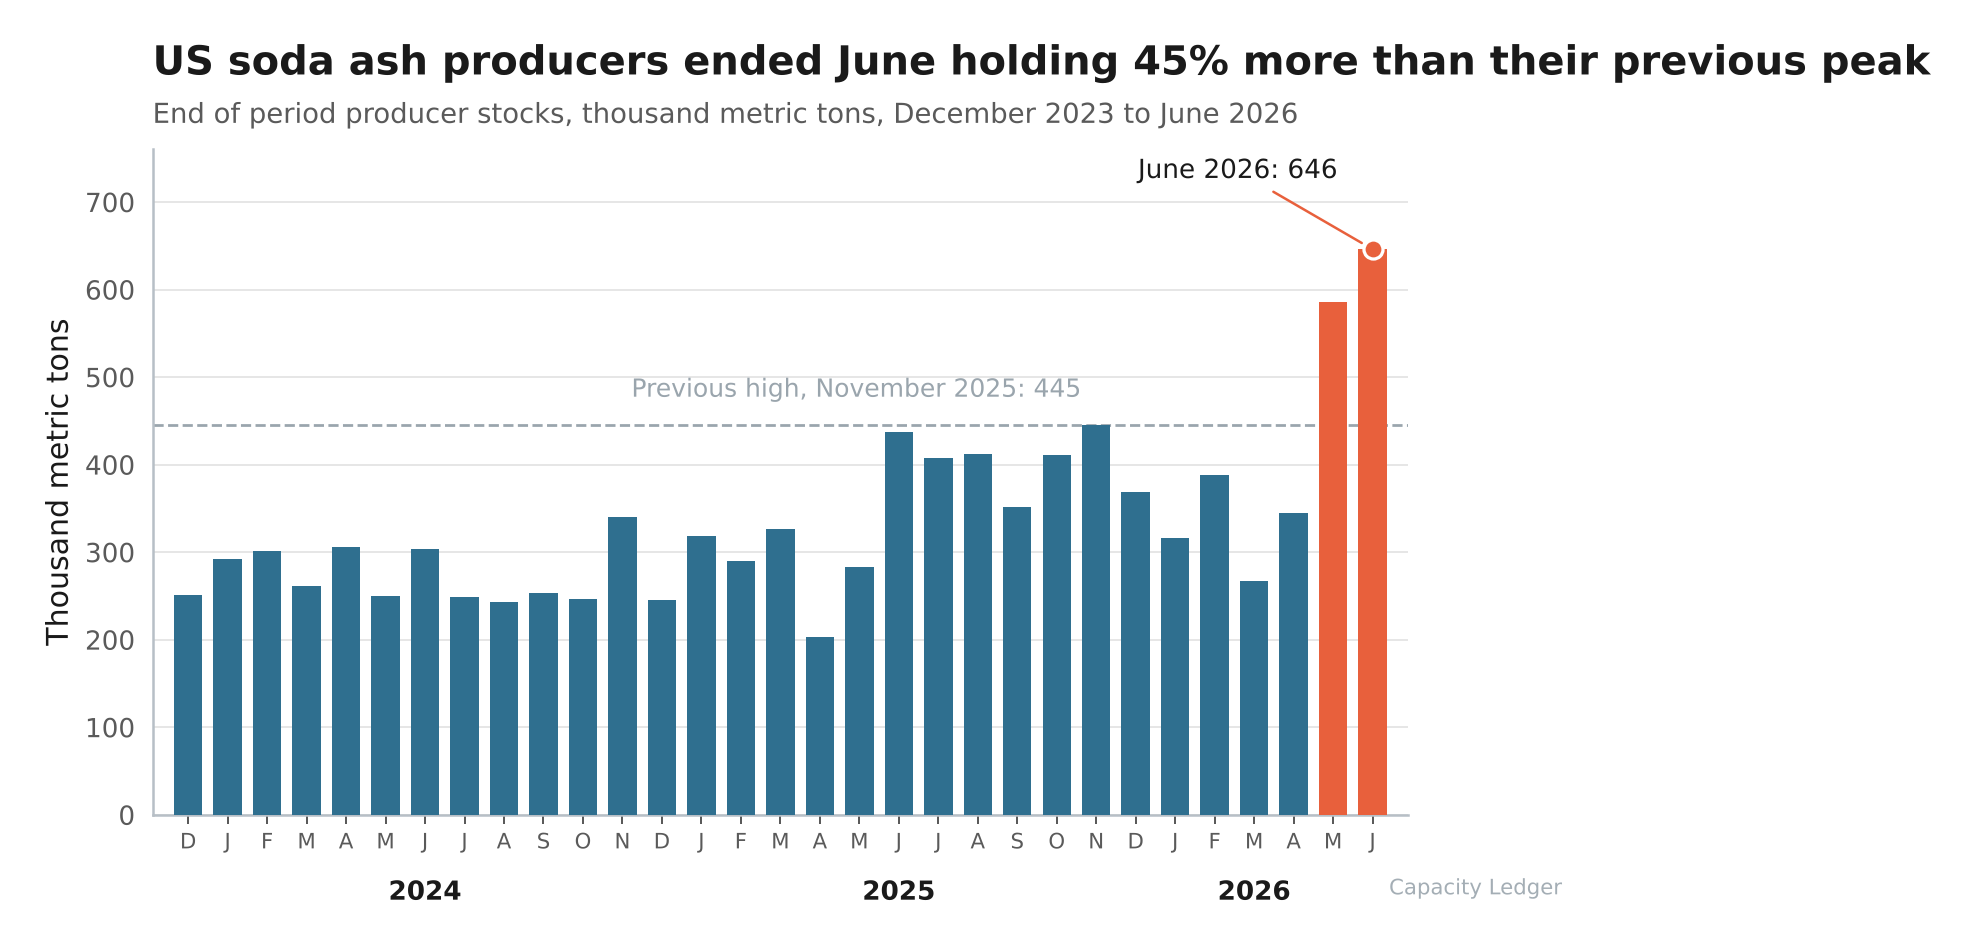
Two bars did all of that. Everything in 2024 lived inside a band of 243 to 341.
"Did the pile build because the plants ran hot, or because nobody came for it?"
Nobody came for it.
The Plants Had Already Been Cut
First-half production ran 5,350 thousand tons against 5,950 in the same six months of 2025. Down 10.1%.
And one of the six plants USGS counted is barely in the 2026 figure at all. Searles Valley Minerals mothballed the soda ash side of its California operation in February, at Argus and Trona, kept Westend going on borates, sent WARN notices to more than 300 people, and filed Chapter 11 on June 15.
So the cut landed, and the pile grew anyway.
Now, look at what did not move. Wyoming trona ore came out of the ground at 9,530 thousand tons in the first half against 9,700 a year earlier, a decline of 1.8%.
The Green River basin is mining at very close to the rate it was mining a year ago. Nearly the whole national production cut is one California plant going quiet.
The Export Book Is the Hole
US soda ash is an export business before it is a domestic one. USGS puts more than half of 2025 production on a ship, and the first half of 2026 ran at 55.0% of output.
First-half exports came to 2,940,000 tons against 3,530,000 a year earlier. Down 16.7%, which is roughly seven points faster than producers cut rate.
June itself moved 423,000 tons, the thinnest month on the 2026 table, into a destination list led by Mexico at 594,000 tons year to date (20% of the total), then Chile at 12% and Brazil at 10%.
USGS named the cause in its own February chapter: prices fell through 2025 on oversupply and weak demand, "largely driven by China's expansion of natural soda ash production in Inner Mongolia, which added about 5 million tons per year of capacity in mid-2023."
All of US output in 2025 was an estimated 12 million tons. One Chinese province added natural capacity worth more than 40% of that in a single step, three years ago, and the market has been digesting it since.
What 646 Buys You
Stocks are a negotiating position, so convert them into one.
First-half apparent domestic consumption ran 2,140,000 tons, about 357,000 a month.
So the end-June pile is 1.81 months of domestic demand. Run the same arithmetic on June 2025 and you get 1.16 months.
Where that lands depends on what you make:
- Glass took 45% of US soda ash in 2025 and chemicals another 28%. Between them, three quarters of the domestic book opens its next negotiation across the table from a supplier holding almost two months of cover in the yard.
- Imports are not your alternative price. Imports for consumption ran 35 thousand tons in 2025, against 115 in 2021, and 89% of 2021 to 2024 arrivals came from Turkey. Year to date, the US has imported 4,070 tons and exported 2,940,000.
The published price has been pointing the same way for two years.
Average unit value of natural-source sales, f.o.b. mine or plant, went from $211.48 a ton in 2023 to an estimated $150 in 2025, a slide of 29%.
Final Thoughts
One caution on the production line specifically. USGS counts soda ash equivalent from soda liquors only, leaves out mine water, and withholds the liquors figure to protect company data, so monthly production reads as a floor rather than a full count.
Stocks and exports carry no such qualifier, and they are the two series doing the work here.
The test is July and August. USGS has published nothing past June and closed that issue's data on September 15, so the next monthly release is the first chance to see the build reverse.
A stockpile that grows through a 10% production cut and a plant closure has stopped looking seasonal, and Wyoming cannot drain it by mining less ore, because Wyoming has barely slowed.
Thanks for reading.