 Capacity Ledger
What Took the Intermediates Four Months?
Between February and June the BLS aromatics index gained 71.9%. The cyclic intermediates made out of those aromatics gained 13.3%. June was the first month the derivative layer moved faster than its own feedstock, and the July print lands Thursday.
If you buy cyclic intermediates on a quarterly formula, the June producer price data put a number on something you have been arguing about since spring: the feedstock repriced in April and the invoice did not.
The Bureau of Labor Statistics keeps two commodity indexes that sit one rung apart in the same chain. Aromatics (WPU06140197) is the benzene, toluene and xylene layer, and cyclic intermediate chemicals (WPU06140281) is what gets made out of it.
Both carry a June 2001 = 100 base and both are unadjusted, so their levels are directly comparable. For two years they tracked each other closely enough to be boring.
In February they sat 4.5 points apart, with the intermediates on top. In June they were 122.1 points apart, the other way around (chart below).
Four Points Apart, Then a Hundred and Twenty-Two
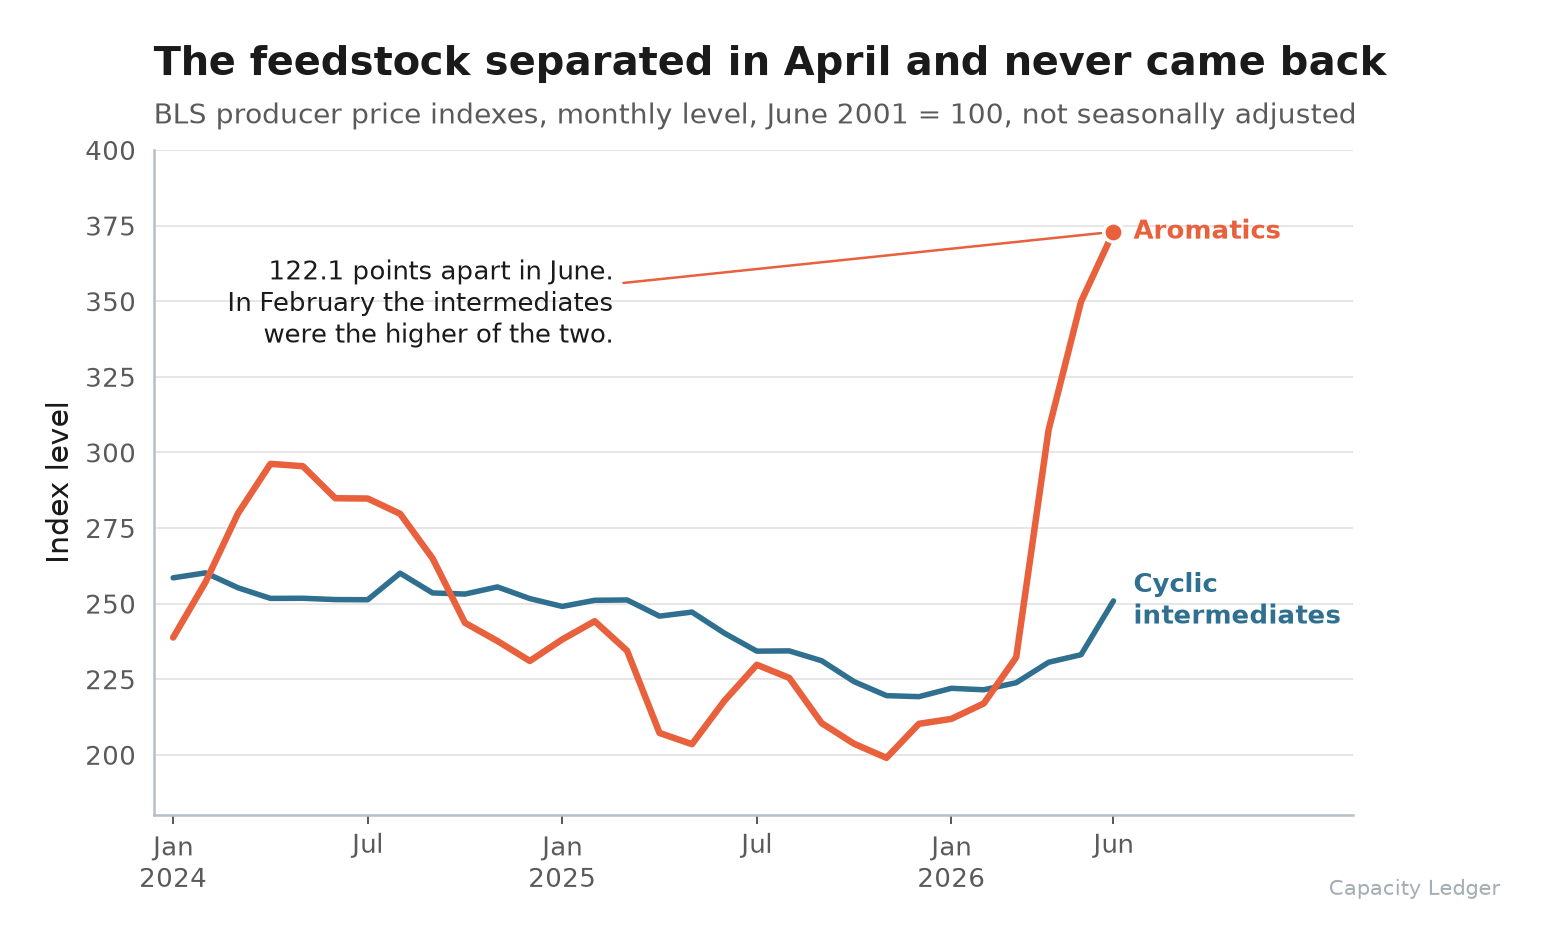
Between February and June the aromatics index gained 71.9%. The cyclic intermediates gained 13.3%. Same four months, same chain, a ratio of 5.4 to 1.
The step is concentrated rather than gradual. April alone took aromatics up 32.4% month on month, from 232.253 to 307.488.
The Strait of Hormuz has been effectively shut since the strikes that began February 28, and NBC's transit tracker, updated August 5, still puts traffic nowhere near the hundred-plus ships a day that ran before the war. An index cannot apportion cause and we are not going to pretend otherwise. What it can do is date the arrival. The aromatics layer took its hit in April, and the layer directly downstream of it took until June to answer.
What the June Print Actually Says
Two numbers in June are worth pulling apart.
Aromatics rose another 6.6%, so the feedstock is still climbing. Cyclic intermediates rose 7.6%, which is the first month since the shock started that the derivative layer moved faster than the thing it is made from.
The gap is nowhere near closed. Year on year, aromatics is up 71.2% and cyclic intermediates are up 4.4%. What June says is that the pass-through has begun, and it began in the month most of you were settling third-quarter volumes.
Two checks that this is aromatics-specific rather than a general energy pull through the whole complex:
- Liquid refinery gases (
WPU06140198), the other primary organic feedstock line, fell 4.4% in June. - Basic inorganic chemicals are up 5.9% year on year, roughly a fourteenth of the aromatics move.
Worth saying plainly: neither index is at a record. Aromatics peaked at 490.9 in February 2013, cyclic intermediates at 291.4 in July 2022. This is a violent move inside a range both series have visited before.
What Thursday Decides
July PPI publishes Thursday, August 13, at 8:30am ET, and the cyclic intermediates line is the one to read first.
- Another print in the 7 to 8% range says the pass-through is a schedule, not a one-month catch-up, and a fourth-quarter formula that assumes February's relationship between the two layers is already wrong.
- A flat print with aromatics holding says the derivative producers are still absorbing it. That tells you which of your suppliers is quietly financing your Q3 and roughly how much longer they can.
Either way, the negotiating fact is the same. The cost is in the chain. It has not finished moving through it.
Final Thoughts
A price index is a lagging document by construction, and this one is running four months behind the event that moved it. That lag is the whole reason it is useful this week: the distance between those two lines is unbilled cost sitting somewhere between a refinery and a reactor, and somebody in the middle is carrying it on their own balance sheet. Nothing in the June data tells you who. The July print starts to.
Thanks for reading.