 Capacity Ledger
Why Chemical Plants Ran Emptier in August Than in 2020
The Fed's August G.17 landed Friday morning with chemical capacity utilization at 71.7 percent, below every month of the 2020 shutdown. Output is only down 2.6 percent in a year. The denominator did the rest of the work, and it has gone up in all seventy-two months since August 2020.
The Federal Reserve published its August industrial production figures on Friday morning, and the chemical sector came in at 71.7 percent of capacity.
That is lower than any month of 2020.
The shutdown low for chemicals was 73.4 percent, in May of that year, with much of the downstream closed by order. August 2026 sits 1.7 points under it with everything open.
"If output is barely down, what is pulling the utilization rate this far?"
The Number, and What It Is Measured Against
Table 7 of the G.17 puts chemicals (NAICS 325) at 71.7 percent for August, against a 1972 to 2025 average of 76.9 percent and a 2009 low of 65.5. The monthly path this year reads 73.6 in March, 73.1 in April, 71.9 in May, 72.3 in June, 71.9 in July, 71.7 in August.
Scan the full monthly series and only one month since May 2014 sits below where August landed: December 2022, at 70.4.
Now put it next to the sector it lives inside. All of manufacturing ran at 75.7 percent in August and total industry at 76.3, a rate the Board itself describes as 3.1 points below its long-run average.
A year ago chemicals and manufacturing were within a tenth of a point of each other. Chemicals has since given up 4.03 points while manufacturing gave up 0.07.
Chemicals carries 12.07 percent of all US industrial capacity, so a four-point move here is a visible share of why the manufacturing average sits where it does.
The Denominator Did Most of the Work
Chemical output in August was 2.6 percent below its year-earlier level. Real, and not nearly enough on its own to take four points off a utilization rate.
Here is the rest of it: the Fed's capacity index for chemicals is 2.88 percent higher than it was a year ago. All-manufacturing capacity grew 1.13 percent over the same twelve months, so chemicals added capacity at more than twice the pace of the sector average while its output fell.
And it has done that every single month for six years (chart below).
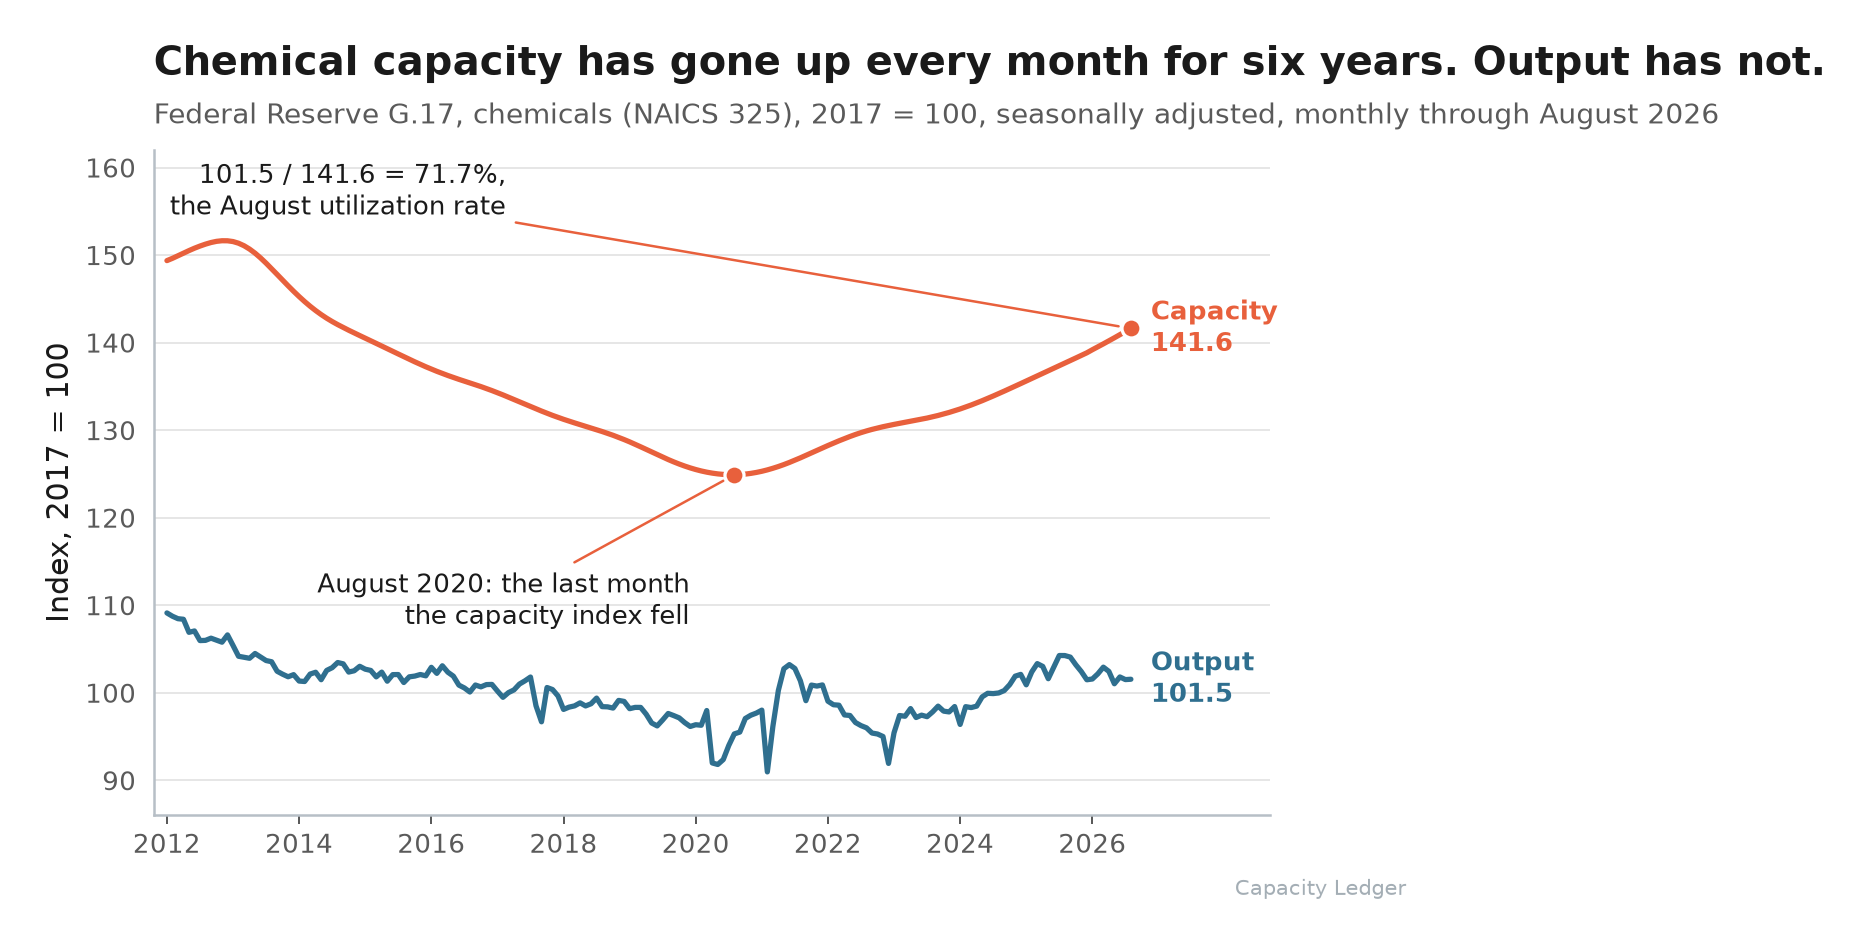
The capacity index bottomed at 124.9 in August 2020 after a twelve-year slide, and it has risen in all seventy-two months since, to 141.6. The arithmetic is not complicated: output / capacity, 101.5 over 141.6, 71.7 percent.
August alone makes the point cleanly. Chemical output was unchanged in the month to the release's own rounding, and capacity went up 0.25 percent.
Utilization fell anyway, 71.9 to 71.7.
Why the Closures You Have Been Reading About Are Not in It
Underneath the August tables sits the Board's notice of its annual revision, scheduled for November 24, 2026. One sentence in it is the whole story for anyone who reads this desk:
"Capacity and capacity utilization will be revised to incorporate data for manufacturing through the fourth quarter of 2025 from the U.S. Census Bureau's Quarterly Survey of Plant Capacity Utilization."
Fourth quarter of 2025. Census has already published first and second quarter 2026 on that survey.
So the capacity path you are looking at for 2026 carries no surveyed 2026 plant data, and the November revision will not add any.
Shell's Martinez catalyst plant, closing on November 30, is a US site inside NAICS 325. It is not in this number and it is not scheduled to be in the next one either.
Worth saying once, since a good share of what this desk has covered this month happened in Europe: the G.17 covers the US industrial sector and nothing else. The Leuna caprolactam line stopping at the end of this month never enters this series at any lag. What it takes off the Western balance still reaches your landed cost.
Capacity here is an estimate of sustainable potential output, in the Board's own phrasing. It is a survey product with a benchmark lag, and right now that lag is running the better part of a year behind the announcements.
Final Thoughts
The temptation with a 71.7 is to read it as slack, and to price your next contract as though every producer you talk to is desperate for volume. Some are.
The quieter thing the number is telling you is that the official denominator has taken in no surveyed 2026 plant capacity at all. When it finally does, the same output will print a higher rate.
Watch November 24 for the level shift rather than the story. The story is already in your inbox from the producers.
Thanks for reading.