 Capacity Ledger
Why the Import Gap Flips Halfway Down the Chain
BLS prints one chemical import number and one chemical export number, and under them are a dozen subsector indexes the release leaves out. Put the two files side by side and the twelve months to September split along the chain: every basic-chemical building block gained on imports, every resin, fiber and petrochemical line lost to them, and 18.58 points separate the ends.
Your supplier and you can both be right this quarter, and which of you is right depends on the NAICS code you buy under.
BLS publishes a chemical import price index and a chemical export price index. Same months, same methodology, neither seasonally adjusted, and at the top level both sitting on a December 2005 base.
Friday the sixteenth printed September for both. Chemical imports up 3.9% over twelve months, chemical exports up 6.3%.
On its own that reads as US producers taking about two and a half points of price back off the imports they compete against.
Go one level down and it stops being one story.
"Which lane carried the bigger increase this year, the imported one or the domestic one?"
Depends where in the chain you stand.
The Line Nobody Prints
Tables 3 and 4 of the release carry NAICS 325 and nothing underneath it. No petrochemicals line, no resin line, no fibers line.
The subsector indexes exist, they just live in the flat files, and seeing them at all means putting the import file next to the export file yourself.
Do that and the twelve months to September split clean along the chain (chart below).
Every building block came out positive:
- Other basic inorganic (32518): US export prices +10.62% against imports at +3.61%. A 7.00 point gap, the widest in the file.
- All other basic organic (325199): +12.43% against +6.06%, a gap of 6.36 points.
- Basic chemicals (3251) taken whole: +11.64% against +6.58%.
Every polymer link came out negative:
- Artificial and synthetic fibers (32522): the US export index fell 0.92% while the import index rose 10.66%. An 11.58 point gap, the widest in the other direction.
- Petrochemicals (32511): exports +12.56%, imports +21.60%. 9.05 points.
- Plastics material and resin (325211): +9.28% against +14.35%.
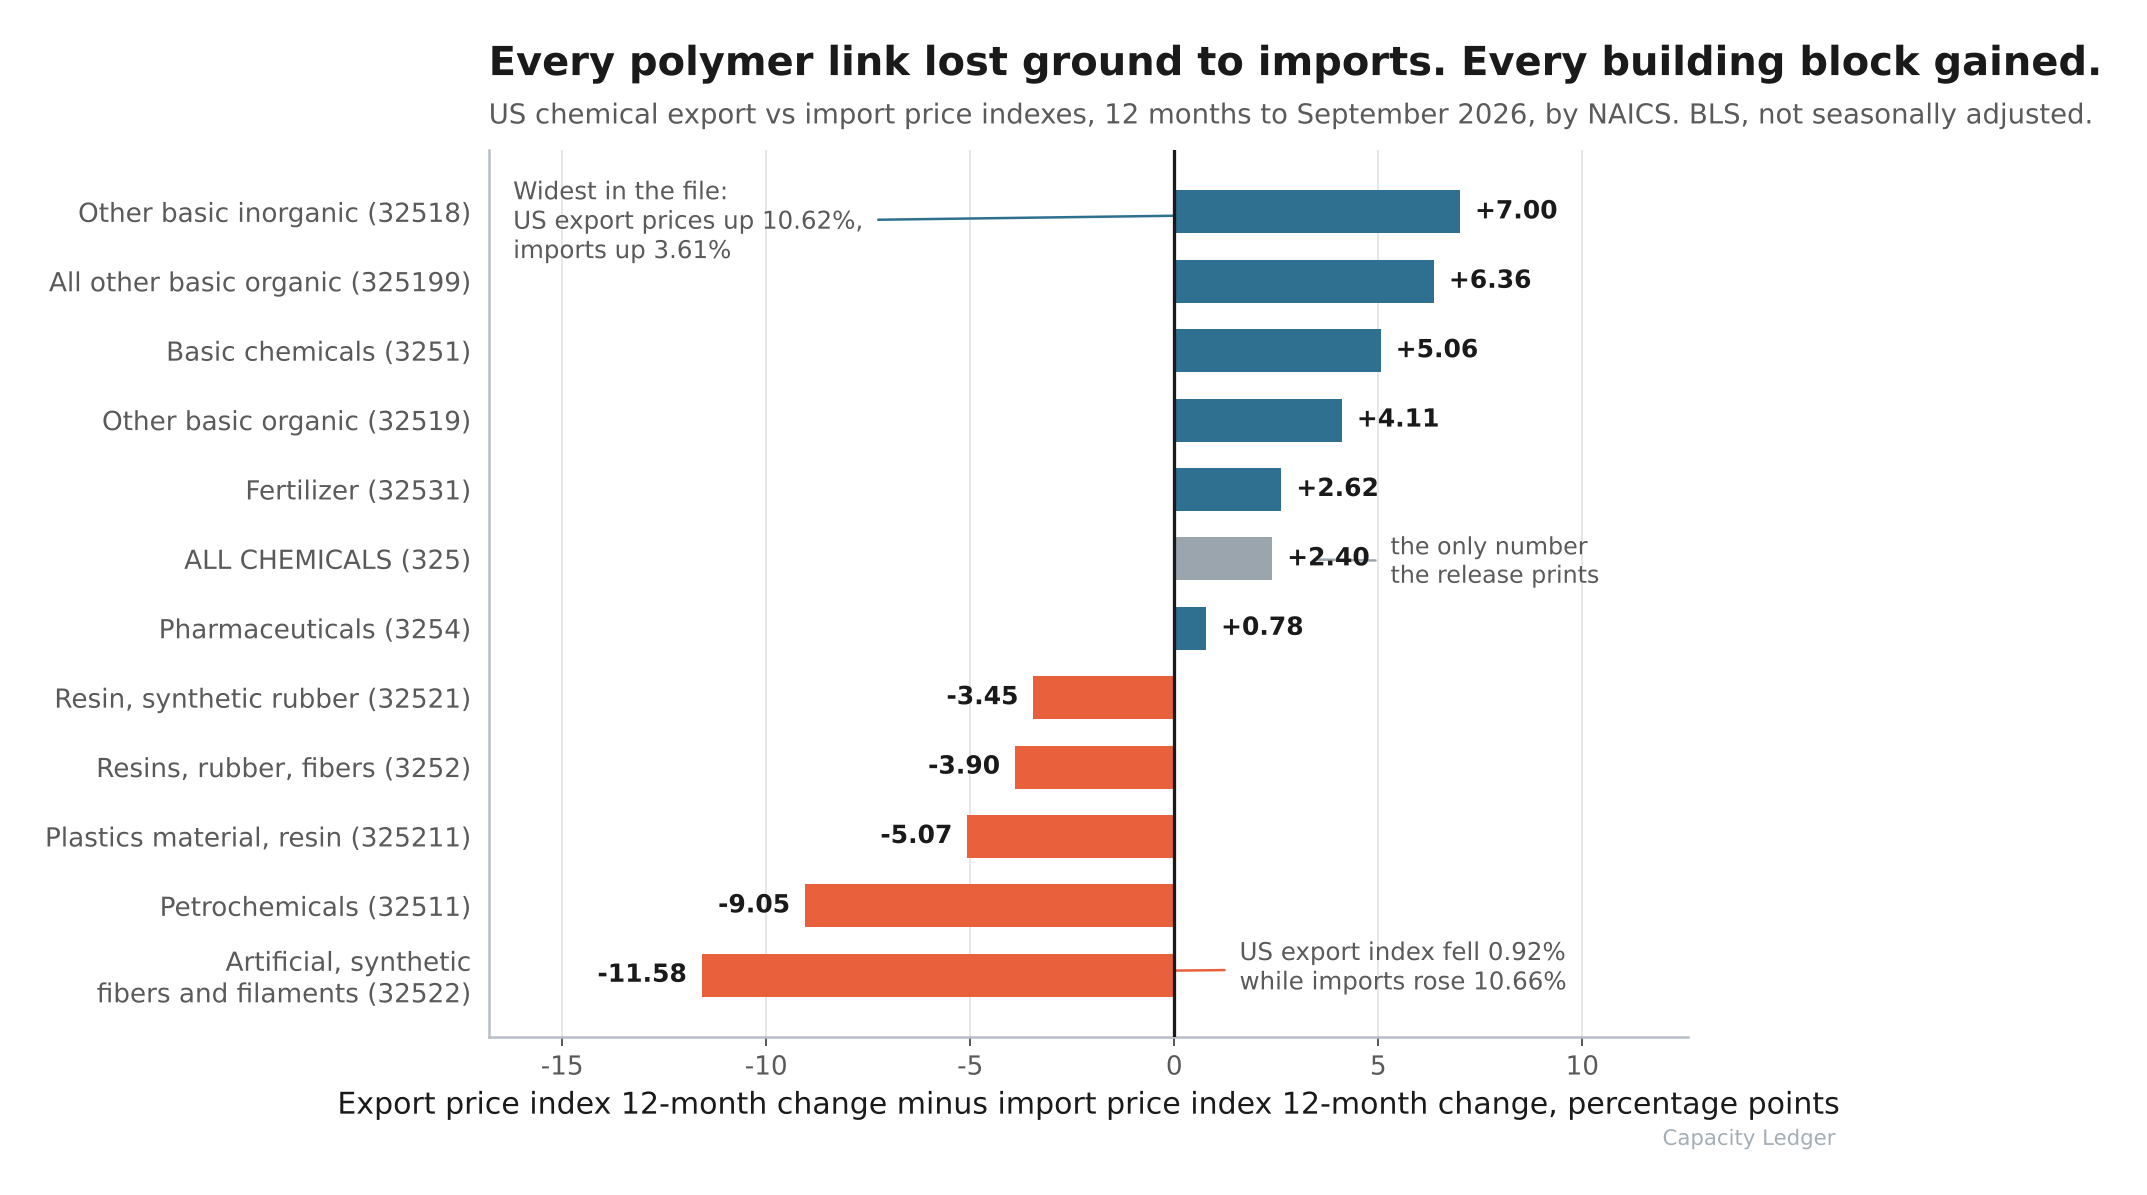
18.58 points between the top bar and the bottom one. The published +2.40 sits in the middle of that distribution and describes nothing in it.
Two Things to Say Out Loud
Hold the inorganic number loosely.
The import index for 32518 printed 59.3 in August and 68.8 in September, a one-month move of +16.02%, and that jump closed the gap rather than opening it. Measured to August the inorganic import line was running down year over year and the gap was far wider than seven points.
The second thing is the history, or the absence of it.
Most of these export subsector series begin in December 2024 or January 2025, so a twelve-month change on them has only existed since January, and there is no prior year to measure this split against. Petrochemicals, resin and synthetic rubber, fibers, fertilizer: all of them start January 2025.
So it is a first reading. It is also the only reading anyone has.
Which Line of the Contract It Reaches
Okay, so what do you do with a split that runs along the chain instead of across it?
- Buying imported petrochemicals or resin, the import-parity leg of your formula moved against you harder than the domestic leg did. Five to nine points harder depending on the grade. A supplier who says "the market" and means the import number is quoting you the faster of two public lines.
- Buying domestic inorganics, the increase ask is running seven points ahead of what the import market actually did. That is a number your counterparty can pull up in the same file you did.
- Fibres is the one to open first. A US export index that went backwards while the import lane rose almost eleven percent is a domestic producer who has not taken price in a year, against imports that have.
Pharmaceuticals, for the record, barely moved either way: +3.80% export against +3.02% import. The flat subsector is the one nobody has to argue about.
Final Thoughts
Those two chemical indexes have run on the same December 2005 base for 249 months. The export line has finished at or above the import line in 11 of them, ten in 2005 and 2006, the last in August 2011.
September's 92.60 is the strongest September since 2014 and still fifteen years short of parity.
That is the slow story and it will outlast this quarter. The quarter's version is simpler: the headline went one way, half the chain underneath it went the other, and the half you buy in decides which of those two numbers counts as evidence in November.
Thanks for reading.