How Synthetic Rubber Got Thirty Percent More Out of the Same Plants
The Fed's July numbers, out Tuesday, put synthetic rubber capacity utilization at 60.7%, up 13.8 points from a September 2024 trough that only one month in fifty-four years has ever undercut. Capacity moved 1.1% over that stretch. The entire gain is production, and it lands on butadiene demand eight weeks before the plant that makes 35% of North America's supply changes owner.
US synthetic rubber plants turned out 30.9% more product in July than they did in September 2024.
They did it with 1.1% more capacity.
That is the Federal Reserve's July industrial production release, out Tuesday morning, and it is the only line inside chemicals where the numerator did the work.
"Which chemical line is actually running better than it was a year ago, and who is selling into it?"
The second-worst month in fifty-four years
Synthetic rubber, NAICS 325212, bottomed at 46.86% capacity utilization in September 2024.
The Board's seasonally adjusted series runs 655 months back to January 1972. Exactly one of them sits lower: May 2020, at 46.09%, when the plants were shut.
July 2026 printed 60.69%. That is +13.83 points off the trough and +4.59 points against July 2025 (chart below).
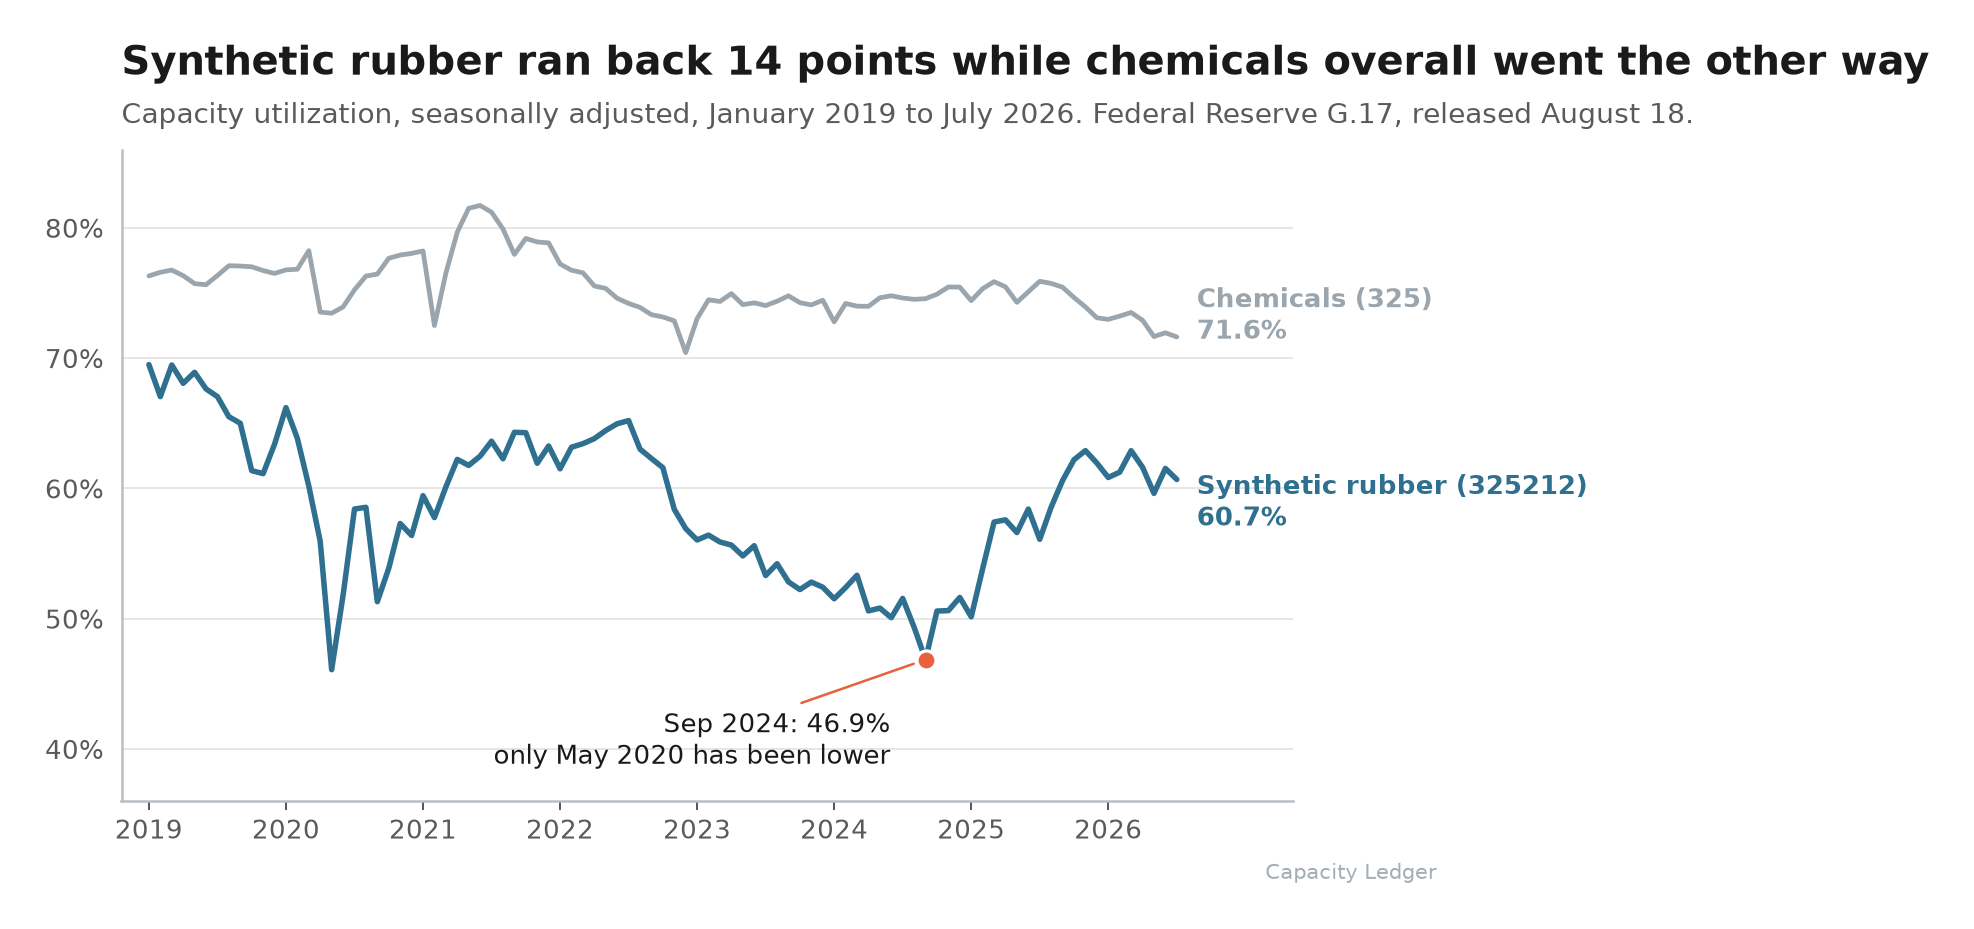
Chemicals as a whole went the other direction. NAICS 325 utilization came in at 71.6%, its lowest month since December 2022, 4.27 points under a year earlier and better than five points under the 1972 to 2025 average of 76.9% the Board prints in Table 7.
Capacity for all of chemicals is up 2.84% year on year while production is down 2.95%. You have read that arithmetic here before.
Synthetic rubber inverts both halves of it.

The rest of this brief is for subscribers.
The capacity math, the trade-flow read, and what it means for the products you buy.
$50 a month, or $400 a year.
Already a subscriber? Sign in