 Capacity Ledger
Which Closure Took Pigments Back to 1982?
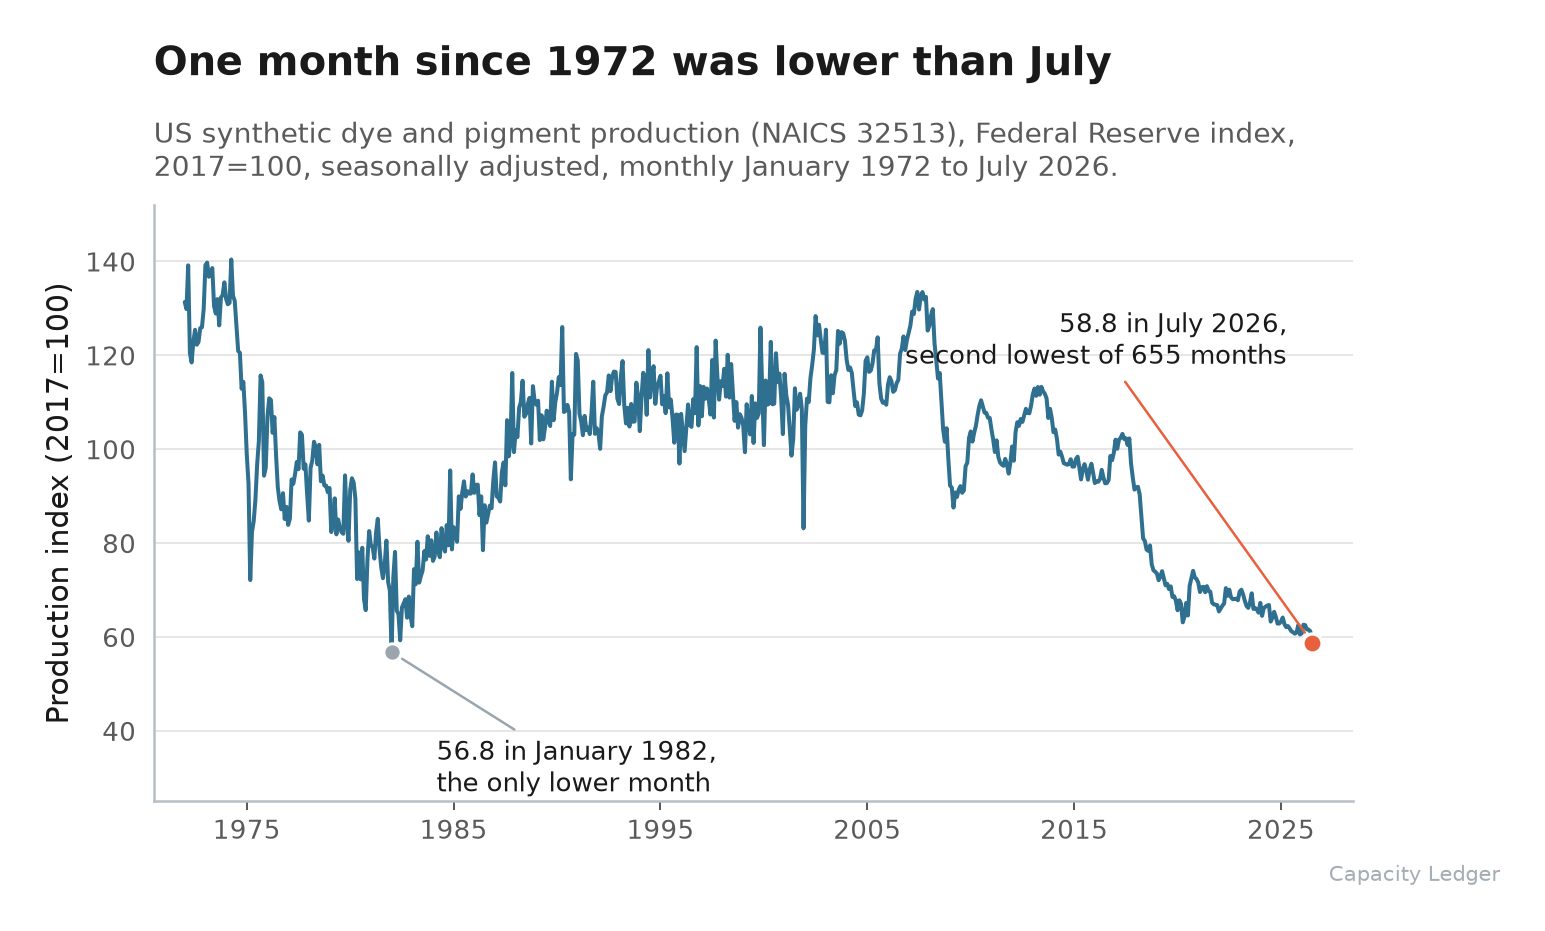
The Fed's production index for synthetic dye and pigment manufacturing printed 58.8 for July, the second-lowest month in a series that starts in 1972. No US closure in our file accounts for it, and the Board publishes no capacity number for the code, so nobody can tell you whether the plants are gone or just slow.
In January 1982 the Federal Reserve's capacity index for American chemical manufacturing stood at 86.7. Yesterday it printed 141.3.
Capacity up 63%, output up 66%, across forty-four years. That is the industry most of this desk's file is about.
One line inside it went nowhere at all.
The Fed's production index for synthetic dye and pigment manufacturing came in at 58.8 for July in Tuesday's G.17, against 56.8 in January 1982. Out of 655 months running back to 1972, that January is the only one sitting below where July landed (chart below).
"Which closure took US pigment output back to a 1982 level?"
We went looking for the ledger entry. There isn't one.
The print
July fell 4.0% from June and 4.0% from a year earlier, which is a large single move for a sub-industry index, and July is preliminary.
The level is what carries. Eight of the ten lowest months in fifty-five years of this series have landed since July 2025.
The base year makes the rest of the arithmetic free. The index is set to 100 for 2017, so July's 58.8 says US dye and pigment plants made 41% less than they were making nine years ago.
The annual averages walk straight down without a pause: 100.0 in 2017, 81.8 in 2018, 71.1 in 2019, 65.1 in 2024, 62.0 in 2025.
Nothing in that path looks like a recession. Recessions are the V shapes further left on the chart.
What is actually inside the code
Worth being exact here, because the obvious guess is wrong.
Census defines NAICS 325130 as establishments "primarily engaged in manufacturing synthetic organic and inorganic dyes and pigments, such as lakes and toners." Its index file puts azo, anthraquinone, acid, disperse and fluorescent dyes in there, along with ferric oxide, chrome, lead, copper and antimony pigments, and organic colour pigments generally.
Two things it explicitly puts somewhere else: titanium dioxide manufacturing and carbon black, both of which sit in 325180 with the rest of basic inorganics.
So this line tracks colour chemistry, the dyes and pigments underneath coatings, inks, plastics and concrete. Your TiO2 supplier reports into a different code, and this is the part of the chain a formulator quietly assumes will always be there.
We were at the healthy end of the same business on Sunday, at LANXESS in Krefeld-Uerdingen, where 300,000 tons a year of iron oxide pigment comes off the Laux process. That plant is in Germany.
The number the Board does not publish
Here is the catch, and it is the reason the question in the blockquote has no clean answer.
The Fed's seasonally adjusted capacity file carries exactly four series inside NAICS 325: chemical as a whole, plastics material and resin, synthetic rubber, and artificial and synthetic fibers. Dyes and pigments is not one of them.
No capacity index means no utilization rate. You can watch this industry's output fall for nine years and never learn whether the plants left or the plants that stayed ran slower, which is the only distinction that matters when you are pricing a two-year supply agreement.
The aggregate actively hides it. Chemical capacity rose again in July, to 141.3 from 140.9, the seventy-first consecutive monthly increase.
The last time that index fell was August 2020.
The customer kept buying
The same release, the same month, the lines immediately downstream:
- Paint and coating output +2.3%
- Paint, coating and adhesive +2.0%
- Pesticide, fertilizer and other agricultural chemical +1.5%
- Pharmaceutical and medicine +0.6%
Manufacturing as a whole was up 0.2% in July at 76.0% utilization. Chemicals ran at 71.6%, its fourth month under 73 this year and well under the 76.9% it has averaged since 1972.
Formulators pulled more in July. The colour going into those formulations was made 4% less of, somewhere other than here.
Final Thoughts
Our file records events. A WARN notice, an 8-K, a surrendered permit, a force majeure letter, a line in a restructuring charge.
That is what a ledger can hold, and it is why the desk can tell you which quarter a cracker or a TDI line leaves the market.
An industry that shrinks 41% in nine years without ever producing one of those documents is invisible to that method, and no amount of reading filings will fix it. Colour pigment plants in this country are small, mostly privately held, and rarely worth a press release when a line comes out.
Which is the practical thing to take from a chart like this one.
Ask your pigment supplier which plant your grade is actually made at now, and whether that plant is in this country at all. The fourth-quarter price is the easier question and the less useful one.
The August figure prints September 16.
Thanks for reading.