 Capacity Ledger
The Closure Wave Never Reached the Tank Cars
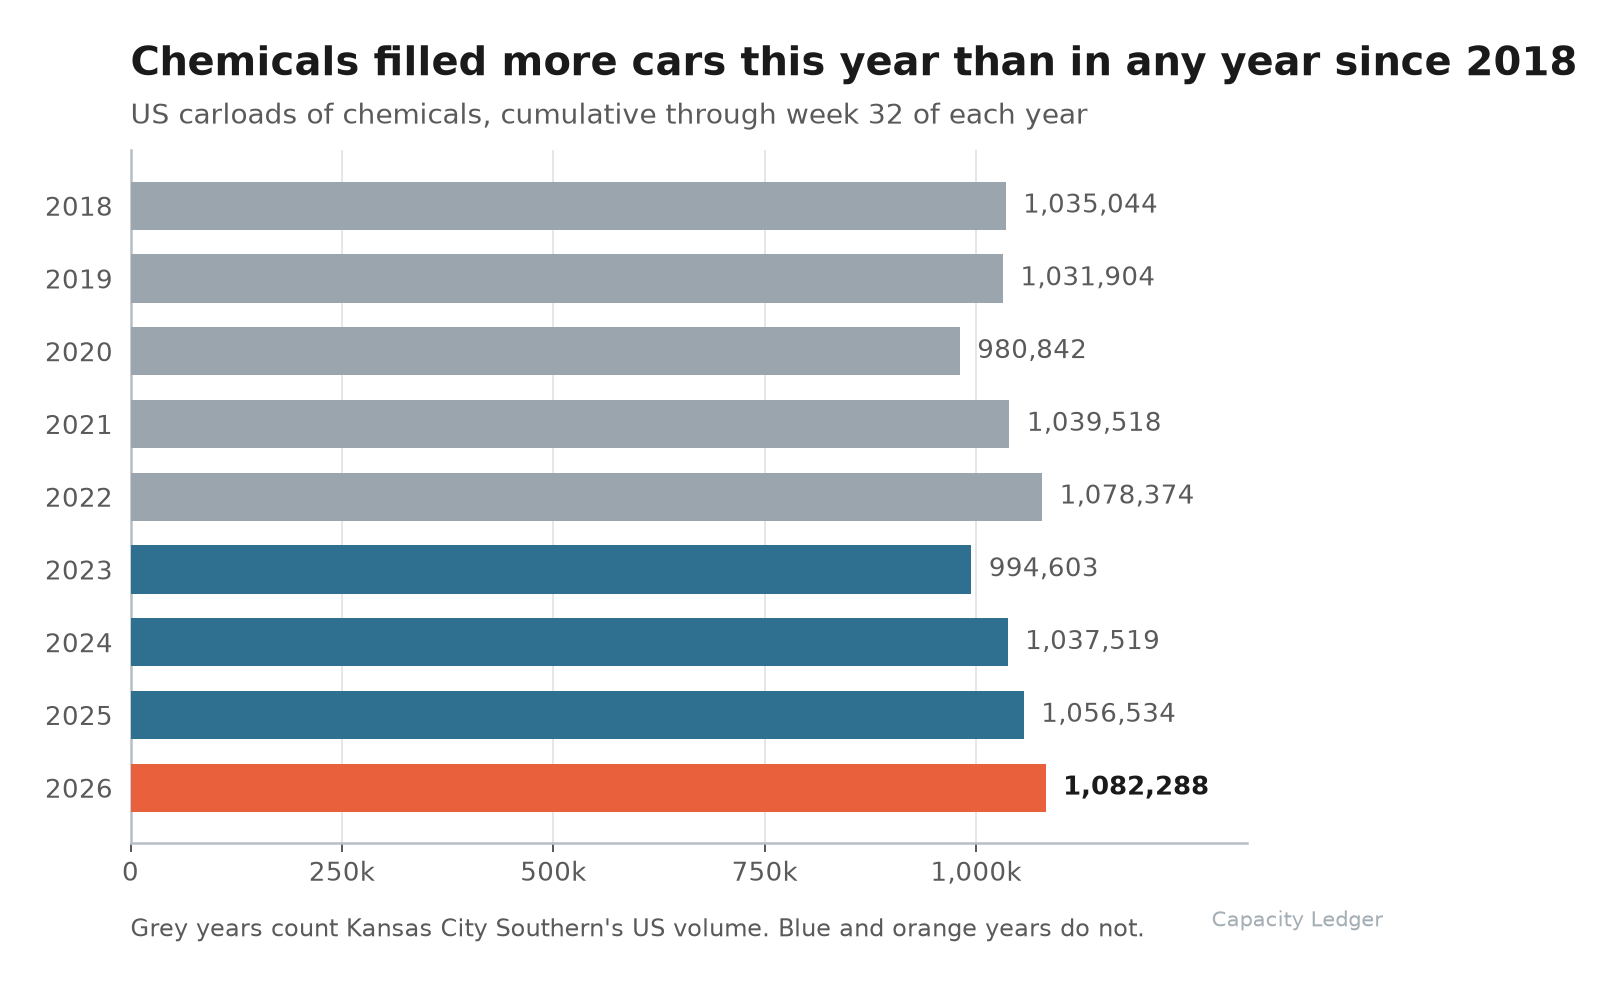
US railroads moved 1,082,288 carloads of chemicals through the first 32 weeks of 2026, more than through the same week of any year since at least 2018, and they did it while counting one railroad less than they counted in 2022. The Federal Reserve's basic chemical index printed its lowest month since December 2022 in the same window.
American railroads moved 1,082,288 carloads of chemicals through the first 32 weeks of this year.
That is more than they moved through week 32 of any year since at least 2018, and it clears 2022, the old high, on a reporting base that is one railroad smaller (chart below).
We have spent this month on subtractions. Closure notices, consolidations into a single surviving site, force majeure letters stacked up along a river that would not float a barge.
None of it is in the carload count.
"If the plants are closing, what is filling the cars?"
The number, and the asterisk
The Association of American Railroads posts the week's traffic every Wednesday and puts the PDF up free.
Week 32 ended August 15. US chemicals came in at 33,539 cars, up 0.1% against the same week of 2025, and the year to date sits at 1,082,288, up 2.3%.
Now the asterisk, which runs the opposite way from the way asterisks usually run.
Footnote 1 on AAR's US table used to read "Excludes U.S. operations of Canadian Pacific, CN and GMXT." From the 2023 reports it reads "Excludes U.S. operations of CPKC, CN and GMXT." Kansas City Southern's American volume moved from inside the series to outside it when the merger closed, and you can size the step from AAR's own arithmetic: the 2023 report puts chemicals at 994,603 and calls that down 3.8%, which implies a restated 2022 base near 1,033,900 against the 1,078,374 the 2022 report published.
So this year's number beats every year in the file while counting less railroad.
Total US carloads went the other way over the same nine years, from 8,347,332 to 7,276,025, down 12.8%. Chemicals were 12.4% of the American carload book in 2018 and they are 14.9% of it now.
What is actually in a chemical carload
AAR's chemicals group is STCC 28, and the association's own fact sheet breaks the originations out.
Plastic materials and resins are 26% of chemical carloads. Miscellaneous industrial organics, where ethanol and urea and liquid methanol sit, are another 25%.
Sodium, potassium and the other inorganics are 13%, fertilizers 7%, industrial gases 3%.
The single highest-volume chemical on American rails is ethanol.
Say that plainly and the record stops looking mysterious. This series is a resin and ethanol gauge with soda ash and anhydrous ammonia riding along. It was never a specialty gauge, and half its book is the two things that are running hardest right now:
- Resin, synthetic rubber and fibre production (Federal Reserve series G3252) averaged 101.0 across January to July against 97.2 in the same months of 2025, up 3.9%. April printed 104.7, the best month that index has seen since April 2018.
- Fuel ethanol production averaged 1,094 thousand barrels a day across the first 32 weeks of the year, against 1,071 last year and 1,046 in 2018. Highest in the window, up 2.2%, which is within a rounding error of the carload move.
Then put basic chemicals next to them.
The Fed's index for NAICS 3251, the petrochemicals and organics and inorganics that this desk writes about most mornings, printed 90.1 in July. Down 6.2% year over year, and the lowest month since December 2022.
Final Thoughts
Be careful what you do with this. A carload is a car, the free weekly carries no weights at all, and rail moves 19% of US chemical tonnage against 57% for trucks.
A grade that ships forty tonnes a month in ISO tanks never touches a manifest train, so every closure in our file could be exactly as advertised and this line would not flinch.
What the series does tell you is where the volume went. The American chemical industry that fills railcars is having its biggest year in at least nine, and it is having it on polyethylene pellets and fuel ethanol. The one the Federal Reserve indexes as basic chemical manufacturing is having its worst July since 2022. Both live inside NAICS 325, both are true this week, and anybody quoting you one number for how the industry is doing has picked one of them and is hoping you will not check the other.
Thanks for reading.