 Capacity Ledger
Twenty-Eight Points Under One Utilization Rate
The Federal Reserve put US chemical capacity utilization at 71.6% for July. The Census survey that supplies most of that number publishes the lines underneath it, and in the same quarter they run from 88.0% down to 59.6%.
Somebody put the Federal Reserve's chemical utilization rate in front of you this month, and it read 71.6%.
That is the July figure, published August 18, and it sits 5.3 points below the industry's own 1972 to 2025 average of 76.9%.
All of manufacturing is 2.1 points below its average. Total industry, 3.1.
So chemicals is carrying most of American manufacturing's slack right now. That much is real.
Now try to negotiate with it.
"Which chemicals is 71.6 percent describing?"
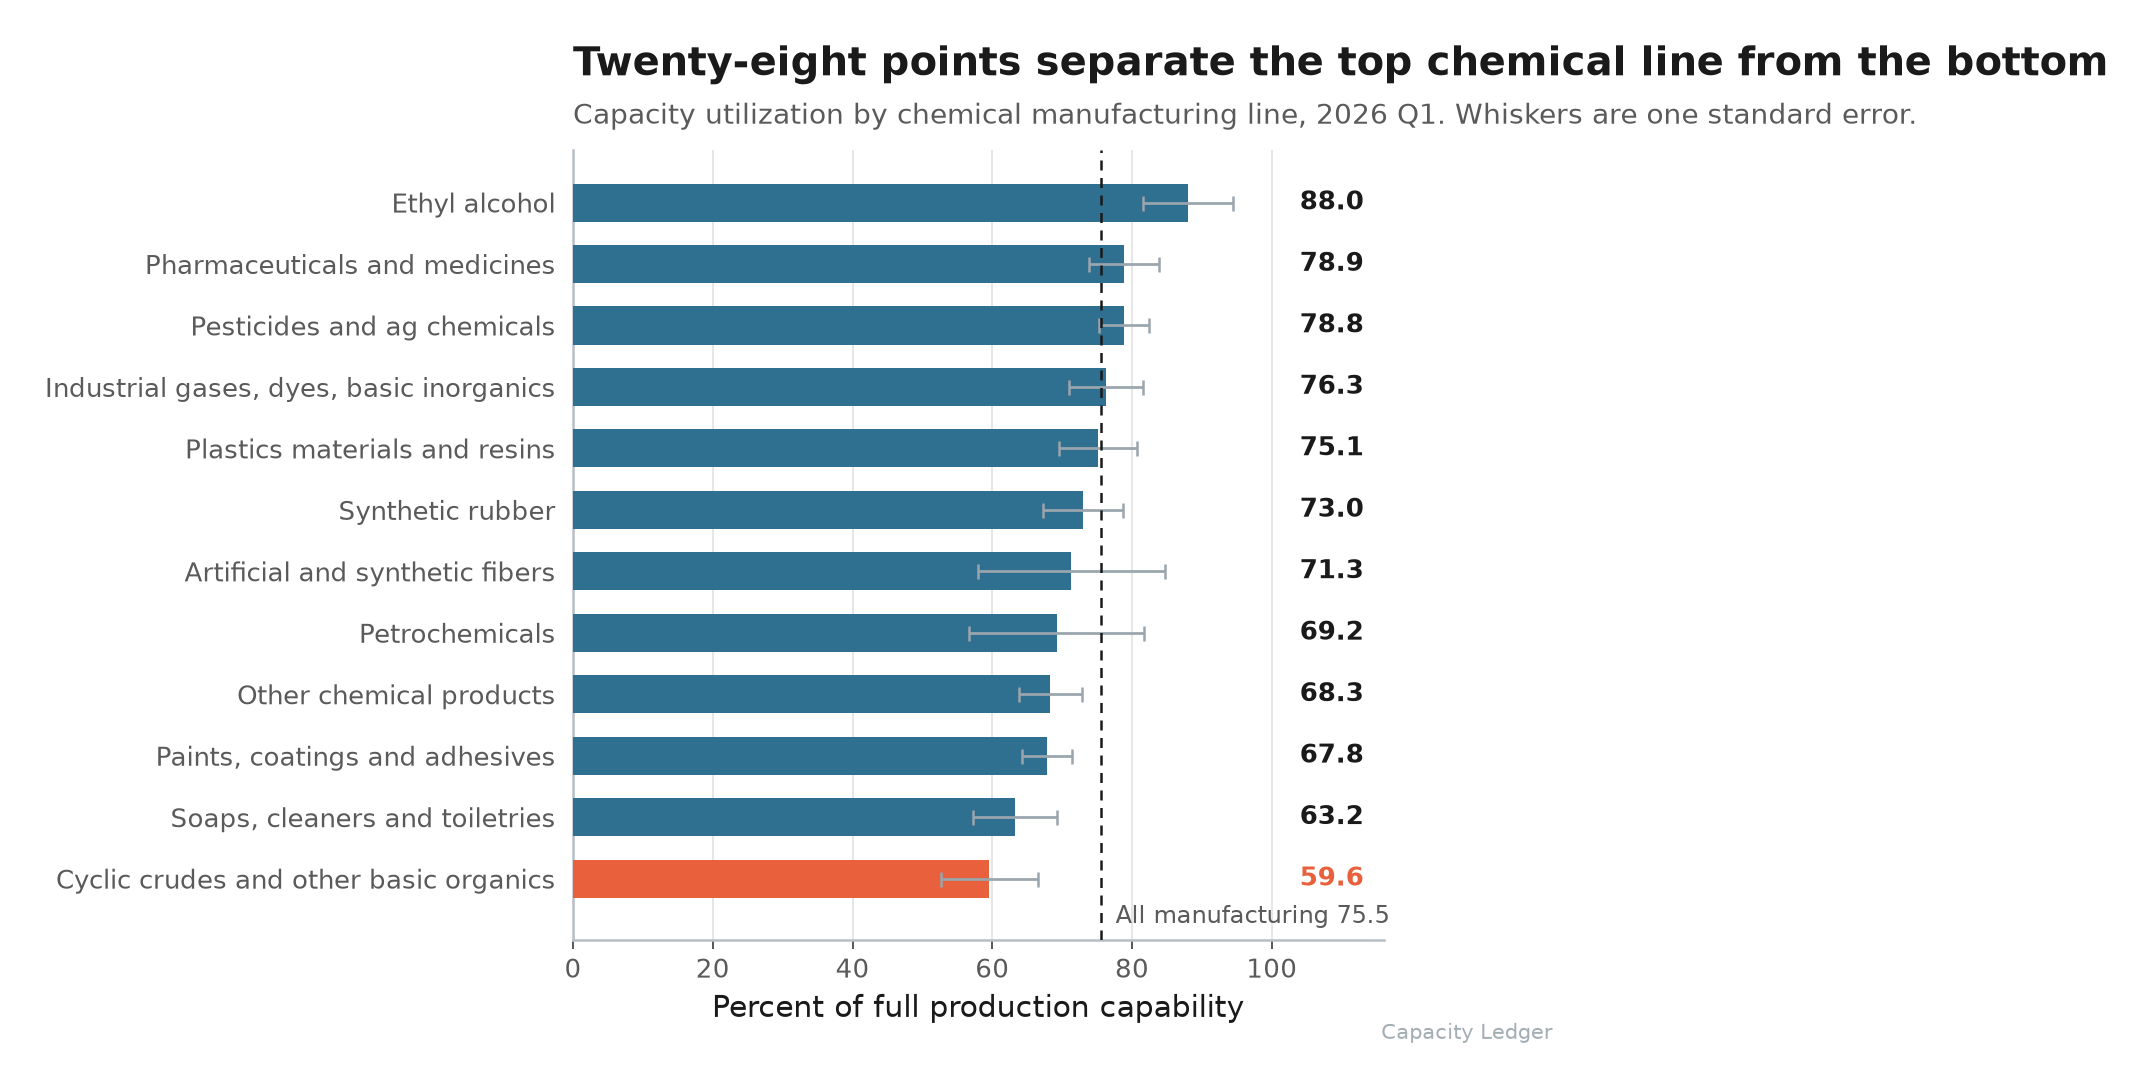
A range wide enough that the average tells you very little about your own line (chart below).
Fifteen production indexes, four capacity indexes
The Board's own G.17 files go a long way below NAICS 325 on the production side. Fifteen series in the 325 family, down to synthetic dyes and pigments and industrial gases.
Basic chemicals printed 90.1 in July, pharmaceuticals 120.2, which is the last three years of this industry in two numbers.
Capacity is a different file.
It carries four: chemicals, plastics materials and resins, synthetic rubber, and artificial and synthetic fibers. Utilization is one divided by the other, so it carries the same four.
Nothing for basic chemicals. Nothing for pharmaceuticals, paints and coatings, soaps and cleaning compounds, or agricultural chemicals.
We spent Thursday evening inside those four, where synthetic rubber has taken back 13.8 points of utilization on a capacity index that moved 1.1%. The other eleven lines are today's problem.
That gap matters more than it sounds, because capacity is where the published rate is actually made. Per the G.17 capacity notes, physical-unit data from USGS, EIA and trade sources cover 26% of capacity. Another 64% comes from "responses to the Bureau of the Census's Quarterly Survey of Plant Capacity." The last 10% is mining and petroleum, where "capacity is based on trends through peaks in production."
Then the monthly series you quote gets assembled: "the monthly capacity aggregate is obtained by interpolating with a Fisher index of its constituent monthly capacity series."
Well, if 64% of it is a Census survey, go read the Census survey.
Twenty-eight points
Census publishes the chemical lines the Fed aggregates away, and the most recent quarter on the table is 2026 Q1. The spread across those lines runs 28.4 points.
Cyclic crudes, intermediates and other basic organics sat at 59.6%. Petrochemicals at 69.2%, paints and coatings and adhesives at 67.8%, soaps and cleaning compounds at 63.2%, plastics resins at 75.1%, pharmaceuticals at 78.9%.
The quarter-over-quarter moves are violent.
Basic organics came up from 47.5% in Q4 2025. Petrochemicals fell from 76.0%. Pesticides and agricultural chemicals went from 66.5% to 78.8% in a single quarter.
Three things to keep in your pocket before you quote any of it:
- Most of these lines carry the Census "c" flag, meaning the rate rests on responses covering less than half the industry. Petrochemicals and plastics resins are the two chemical lines that clear that bar.
- Fertilizer and compost printed 80.9% with a standard error of ±26.1 points, so it is off our chart. An estimate that spans 55 to 107 is not an estimate.
- The whole quarter rests on unit response from about 34% of the mailed sample.
Half of this year's slack came from the denominator
Utilization is production over capacity, and this year both halves moved.
US chemical production fell 2.95% in the twelve months to July. Chemical capacity rose 2.84% across exactly the same twelve months.
Split the 4.27-point drop in utilization and it comes apart almost evenly:
- Hold capacity at last July's level and this July's output would have printed 73.66%. Call that 2.24 points of the fall.
- The other 2.03 points is capacity growth alone. 48% of the decline.
That growth is accelerating. +2.84% year over year is the fastest twelve-month rate since April 2008, and the series has not printed a negative year-over-year number since January 2021.
Here is the catch. What the survey counts as a change in capability is mostly not steel.
Among chemical plants that reported a change last quarter, 42.6% checked "price changed, product mix same" and 33.0% checked a change in product mix or specifications.
Machinery capital expenditures got 15.9%, machinery retirements 1.1%, and building retirements 0.0%.
Building retirements at zero, machinery retirements at one. Whatever moves that capability number quarter to quarter, plant exits are not doing the work.
Final Thoughts
None of that makes the Fed's number wrong. It makes it an average of a survey, interpolated into months, describing an industry that runs from fuel ethanol to peptide APIs.
The capacity index is still 12.2% below its March 2008 peak, so the long shrink is genuinely there in the data. It has also climbed in every one of the last five years, which is how a year of closure notices coexists with a denominator that keeps rising.
Capacity leaving a specific plant and capacity leaving a national index are two different clocks, and the second one runs slow.
If you are pricing a basic organics contract this quarter, the number that describes your counterparty's plant is 59.6, with a seven-point error bar, from a survey a third of the industry bothered to answer. Use it that way and it is worth something.
The 71.6 is for the macro desk.
Thanks for reading.