 Capacity Ledger
Who Raised Price Faster, the Plant or the Port?
BLS prices fourteen chemical NAICS industries twice, once at the American plant gate and once at the foreign port. This morning's import release lets you line the two up for August, and in nine of the fourteen the American price outran the import.
Your purchasing system holds one price for a molecule. BLS holds two.
At 8:30 this morning it published the second one for August.
"When the American plant and the foreign port both reprice, which of them moved more?"
The Same Industry, Priced Twice
The Producer Price Index measures, in BLS's own words, "the average change over time in the selling prices received by domestic producers for their output." The import price index measures what somebody paid a foreign producer for the same thing.
Both are classified to NAICS. So for any industry that appears in both files you can read the American price and the imported price off the same six digits.
Fourteen six-digit chemical industries qualify, meaning they carry an August 2026 print on both sides and an August 2025 figure to measure against. That is the whole intersection of the two files, not a shortlist.
In nine of the fourteen, the domestic price outran the imported one over those twelve months (chart below).
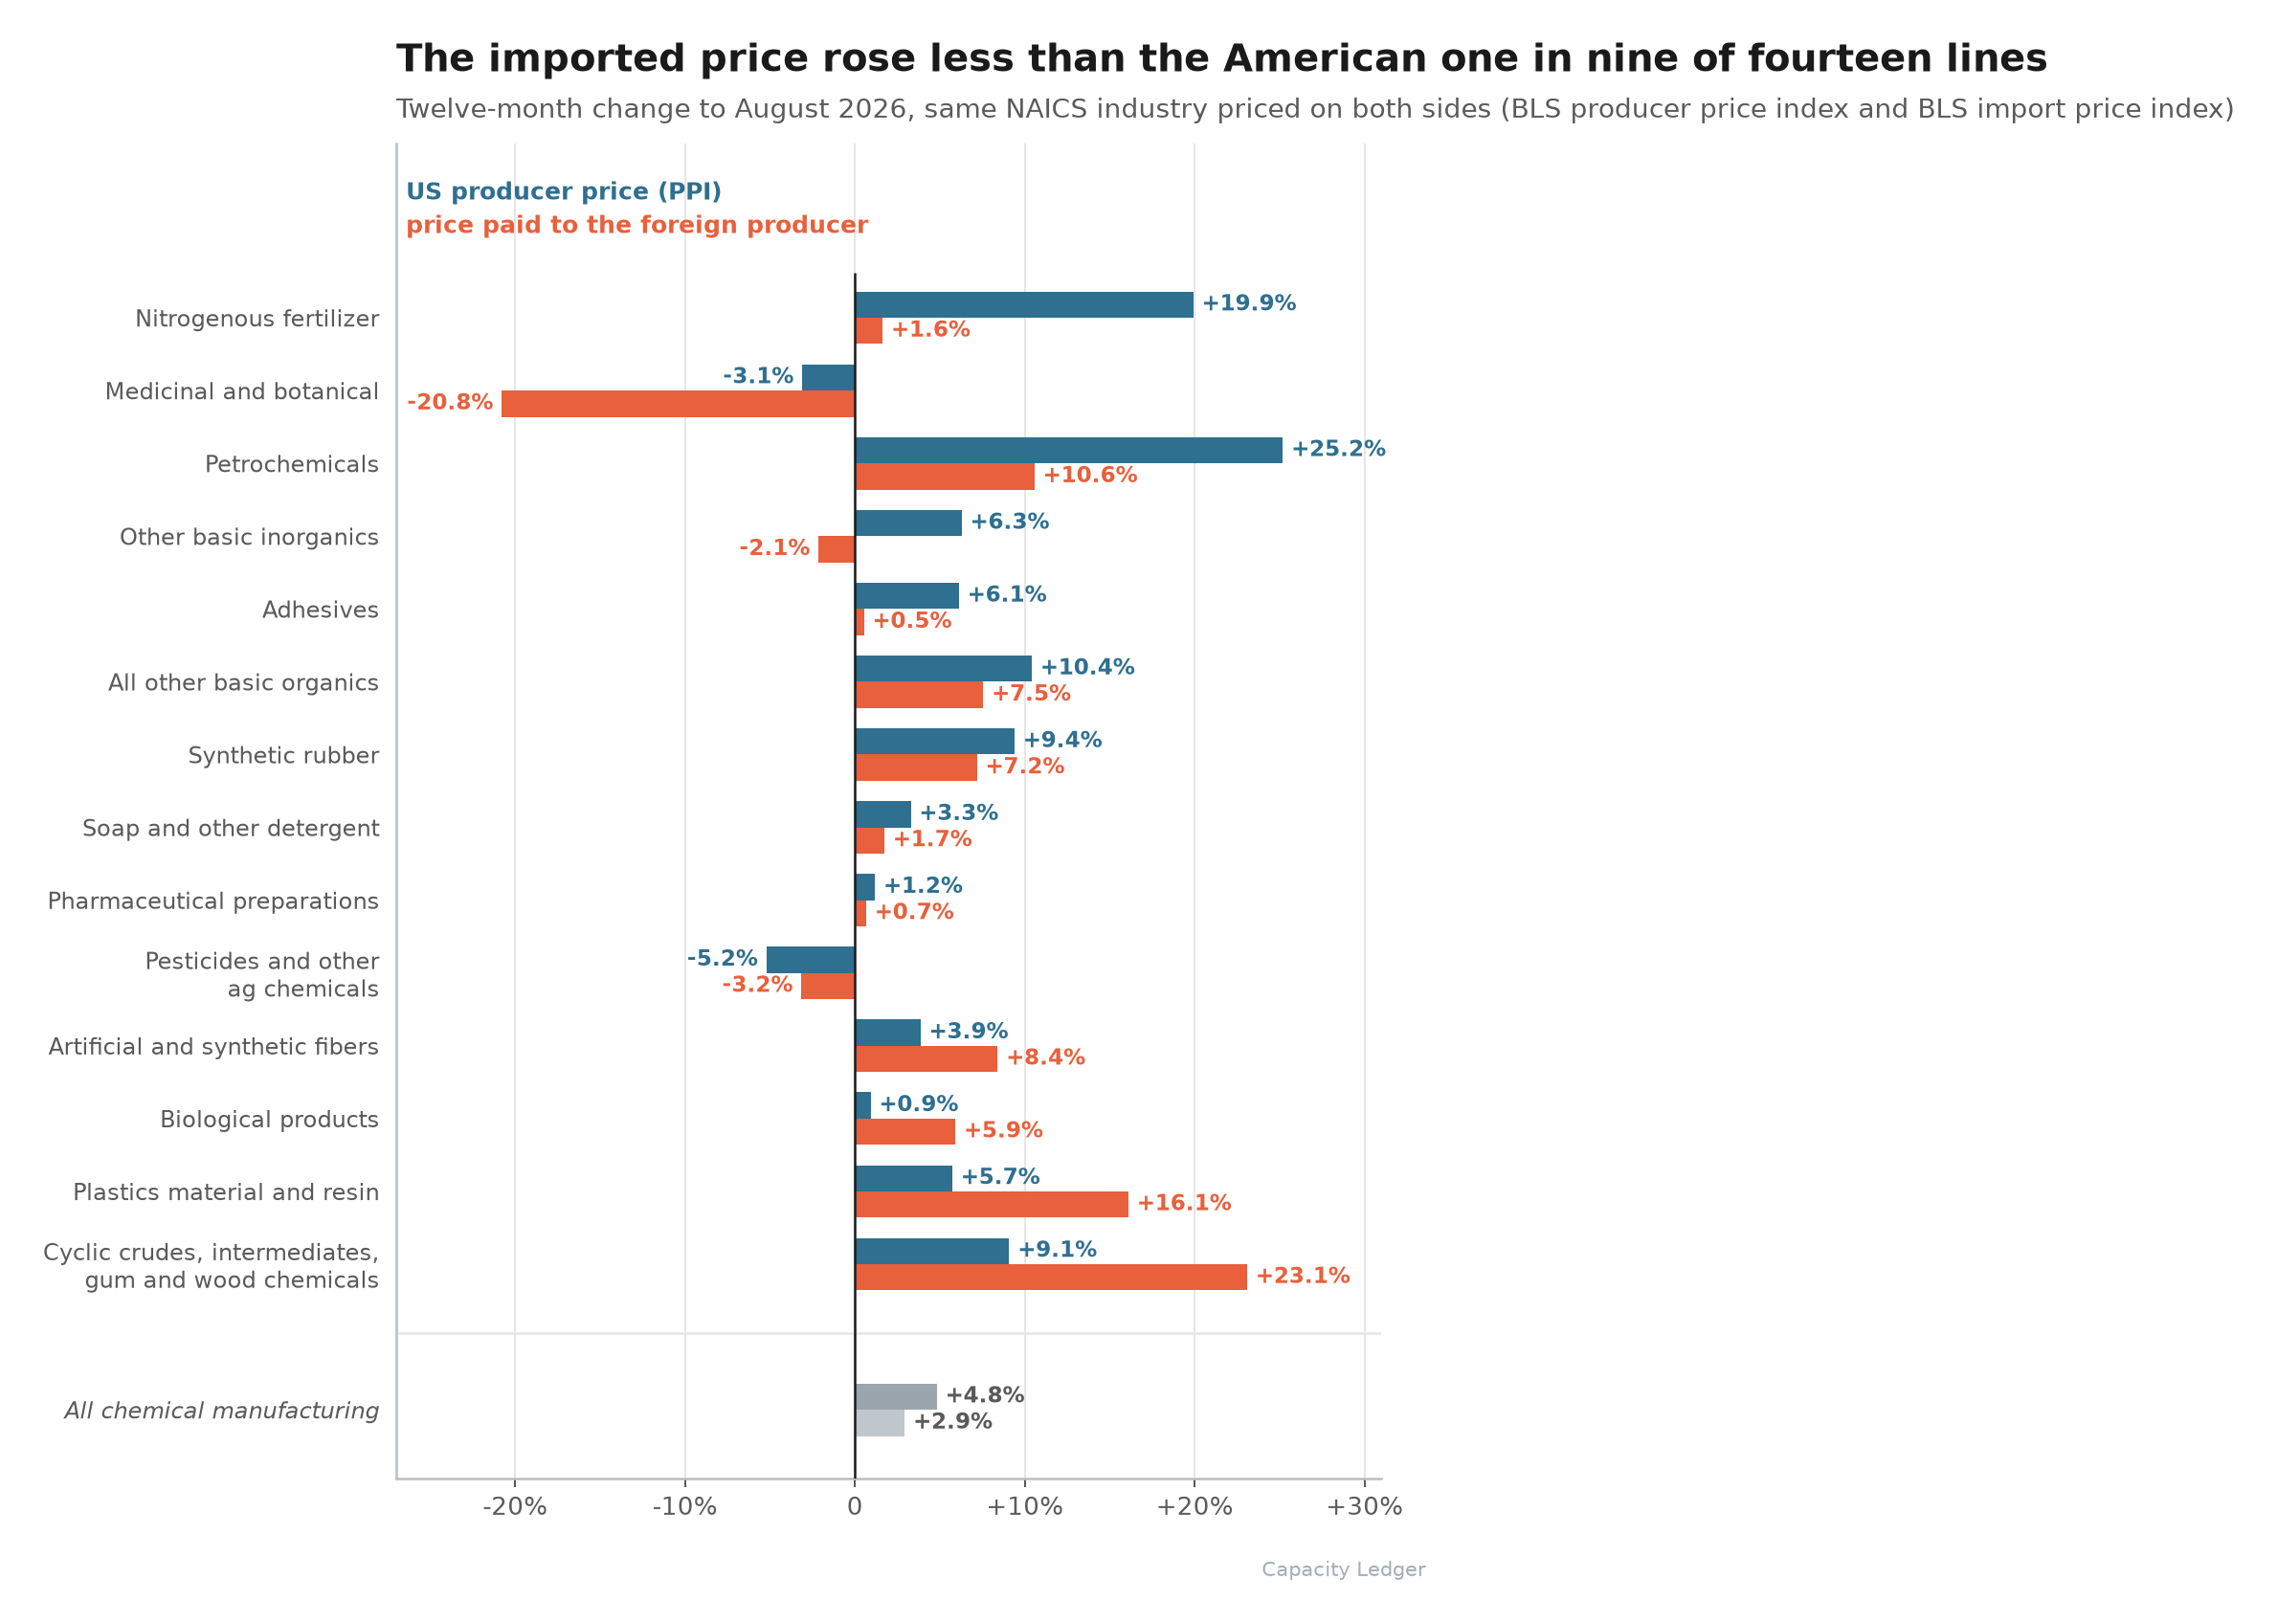
At the sector line the gap is narrow and easy to miss: all chemical manufacturing up 4.8% domestically against 2.9% imported, a difference of under two points. Nobody reprices a contract off that.
Go one level down and the same comparison runs from 18.3 points in the domestic direction to 14.0 points the other way. Thirty-two points of spread inside a two-point average.
Where the Gap Is Widest
Nitrogenous fertilizer is the extreme. American producers took +19.9% on the year while the imported index moved +1.6%.
Petrochemicals carries the largest domestic increase on the board: +25.2% against +10.6% imported. Two more lines tell the same story:
- Other basic inorganics: +6.3% domestic, -2.1% imported. The imported inorganic is cheaper in dollars than it was a year ago while the American one is dearer.
- Adhesives: +6.1% domestic, +0.5% imported.
Now the five exceptions, because they are not scattered at random. Three of them sit in the same corner of the book:
- Cyclic crudes, intermediates, and gum and wood chemicals: +9.1% domestic against +23.1% imported.
- Plastics material and resin: +5.7% domestic against +16.1% imported.
- Artificial and synthetic fibers: +3.9% against +8.4%.
The other two are biological products (+0.9% against +5.9%) and pesticides and other ag chemicals, where both sides fell and the American side fell harder (-5.2% against -3.2%).
The cyclic crudes line is worth a second look if you read the desk's August 27 piece, "The Spike Stopped at the Formulator," which charted the domestic side of all eighteen chemical industries and put 325194 at +5.1% to July.
One month later the domestic index reads +9.1% and the import index for the same industry reads +23.1%. We only had half of that picture last month.
And the August month by itself: the all-chemicals import index printed 154.5, exactly where July left it, a change of 0.00%. Inside that zero, other basic organics rose 3.53% in the month and other basic inorganics fell 3.19%.
That organics move is the fifth-largest one-month rise in a series that starts in December 2005, and June of this year is the third-largest. Two of the five biggest monthly jumps in twenty years landed in the last quarter.
Here's the Catch
Everything above is priced before the tariff schedule.
BLS is explicit about it: "The prices for the items used to calculate the Import/Export Price Indexes exclude duties," and "the majority of prices used in calculating import price indexes are quoted FOB (Free On Board) Foreign Port."
So the import column is the foreign producer's own price move, measured at their dock. It is not a landed cost, and the gap between the two columns is the start of your arithmetic rather than the end of it.
The duty line comes after.
One more piece of the same release worth having.
Split the all-chemicals import index by where the tonnes came from and the twelve-month change runs from +9.6% on Japanese chemicals and +8.7% on Latin American ones down to -0.7% for the Pacific Rim as a group, with Japan sitting inside that group by BLS's own definition. The European Union came in at +2.6% and China at +2.4%.
Final Thoughts
Two caveats, said once. Every PPI month from May onward carries the BLS preliminary flag and stays revisable for four months, and the two index families have different reference bases, so only percent changes belong in the same sentence, never levels.
What survives both caveats is the shape. For most of the basic chemical book, the American molecule repriced harder than the foreign one over the last year, and the exceptions cluster in resin, fiber and aromatic intermediates.
A capacity ledger usually reads that as a story about who shut what. This is the other half of it: the price your domestic supplier can hold, measured against the alternative source you actually have.
Thanks for reading.