Census Never Prints the Chemical Line You Buy From
Tuesday's manufacturing book put chemical shipments at a record $89.4 billion, and three fifths of that sits in a sub-line Census collects every month and has never published. Back it out and the inventory cushion behind the molecules you actually buy reads 1.12, the thinnest since 2018, against a printed 1.48.
Census prints three chemical sub-lines in the monthly manufacturing book. It collects four.
The September Full Report landed Tuesday morning, release CB26-170, and the chemical line in it set a record: shipments of $89,381m, the highest of the 417 months the series has run. The headline inventories-to-shipments ratio for chemical products came in at 1.48.
That 1.48 describes a shelf you probably do not buy from (chart below).
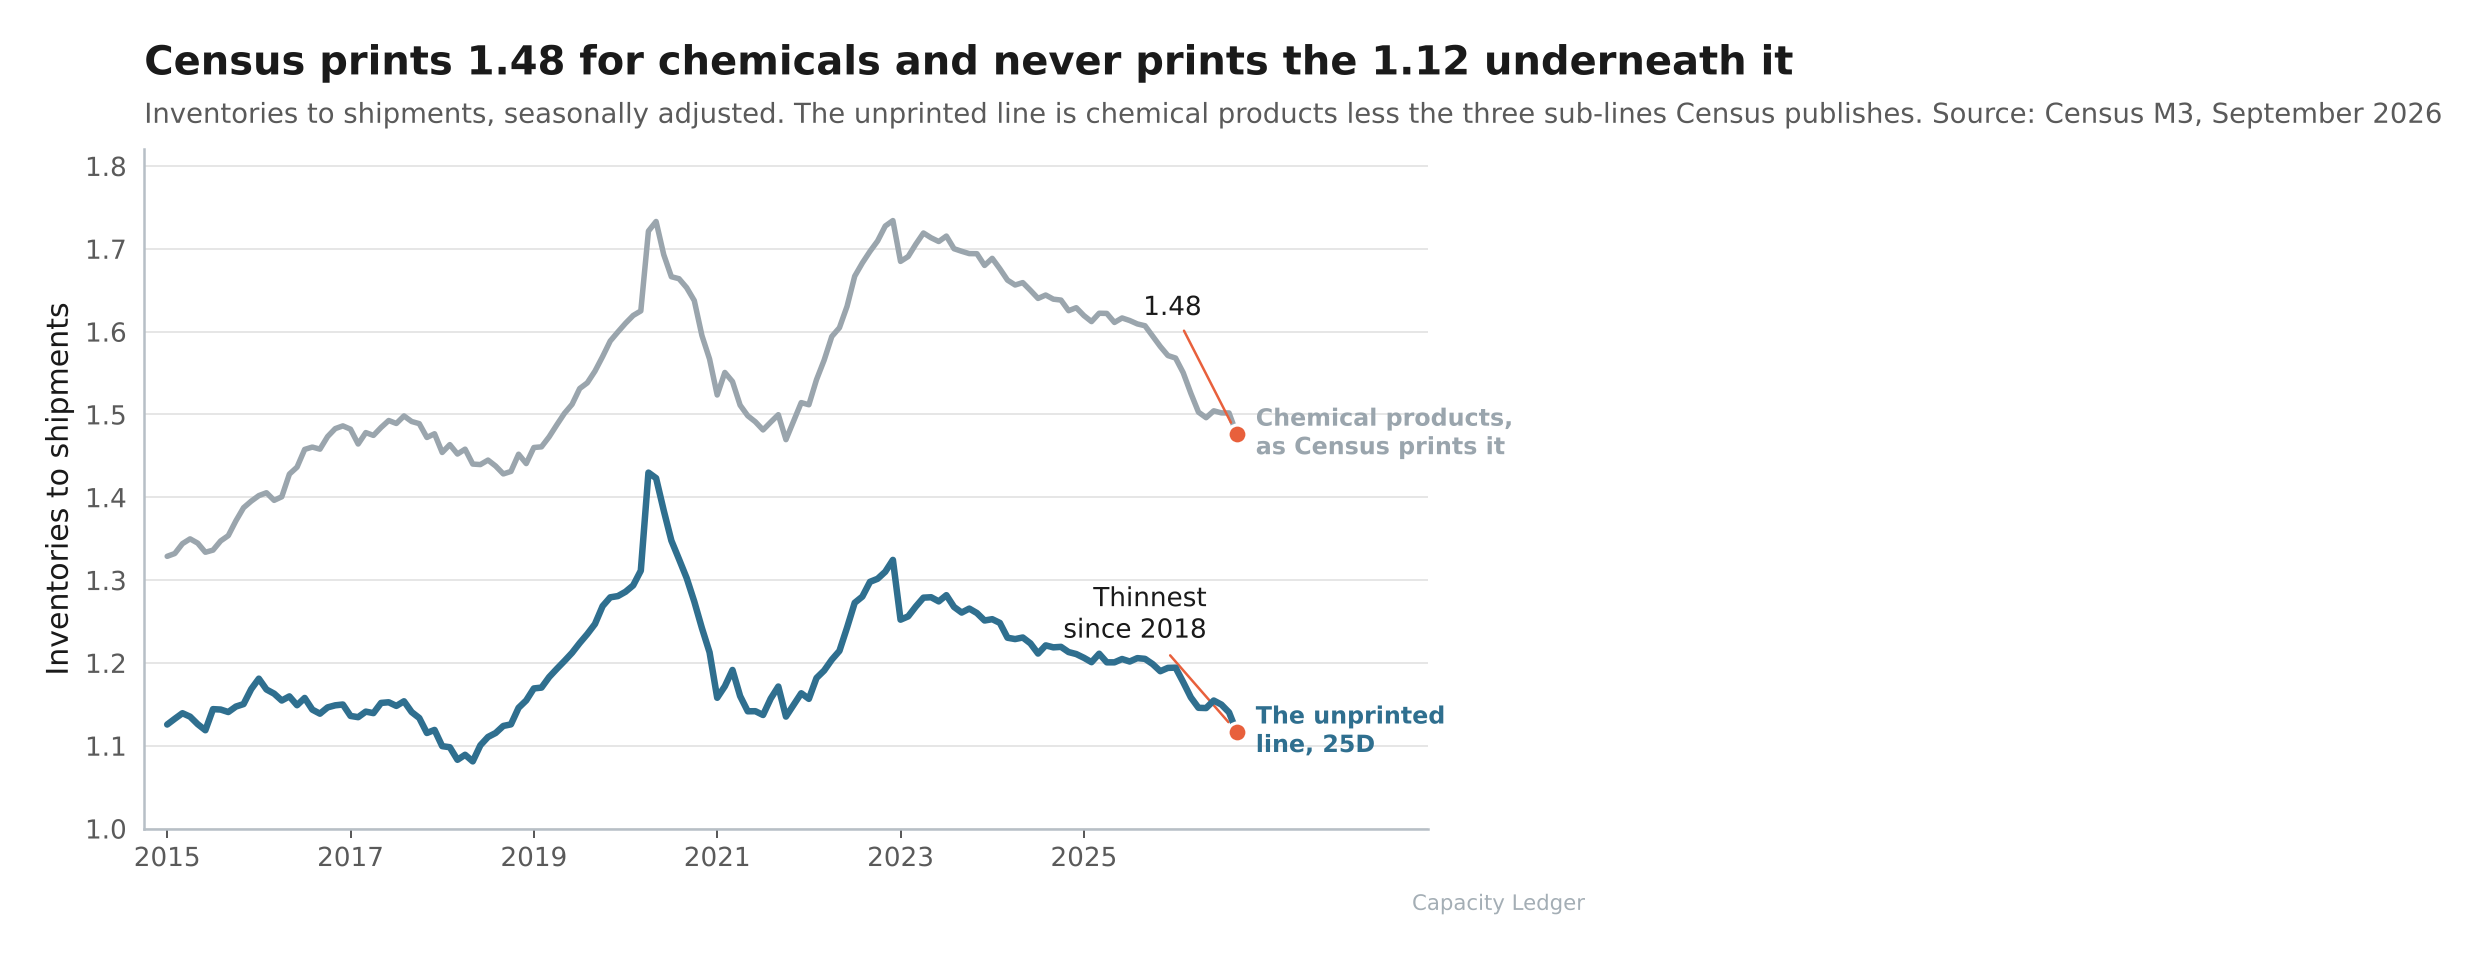
"What does the chemical inventory number look like once you take the pharmacy out of it?"
The three sub-lines Census publishes under chemical products are pesticides and fertilizers, pharmaceuticals and medicines, and paints, coatings and adhesives. Between them they carry 40.19% of chemical shipments.
The other 59.81% has no printed line at all.

The rest of this brief is for subscribers.
The capacity math, the trade-flow read, and what it means for the products you buy.
$50 a month, or $400 a year.
Already a subscriber? Sign in